
What Is Mindshare? How to Measure Crypto, AI and Stock Market Attention
Learn what mindshare measures, how it differs from mentions and sentiment, and how to investigate attention shifts across crypto, AI and stocks with Kaito.
Mindshare is a metric that helps measure how much attention is concentrated around a particular brand, company, asset, or topic within a defined period of time. It’s a useful indicator when you’re conducting research, comparing your project with competitors, identifying trending topics to create content around, or simply trying to understand what people are discussing online.
You’ve probably heard the word mindshare thrown around quite a bit. But if you’re still not entirely sure what it means, this article is for you. Mindshare is also easy to confuse with other online attention metrics, including mentions, share of voice, sentiment, and market share.
We will in detail explain what mindshare is, how it differs from other attention metrics, and how you can measure it across crypto, AI, and stocks.
What is the difference between mindshare, share of voice and sentiment?
Mindshare measures attention, share of voice measures visibility relative to competitors, and sentiment measures the tone of discussion. Note that all of these metrics often have somewhat different definitions, therefore, we recommend that you always check out how a tool for online analysis actually defines them.
In this case, mindshare refers to attention measured through online activity. Yet, in traditional brand research, it can also be used to measure how well people remember a company.
| Metric | Question it answers | What to check |
|---|---|---|
| Mindshare | What is the amount of attention (expressed as a percentage) that any subject receives out of all observed attention? | Comparison group, sources, weighting and period |
| Mention count | How many times was this subject discussed? | Duplicates, irrelevant matches and coordinated posting |
| Share of voice | How much measured visibility belongs to a certain brand? | Whether impressions, or mentions, used to measure visibility |
| Sentiment | Is the discussion positive, negative or neutral? | Classification method and sufficient underlying discussion to gain insight from it |
| Market share | How much of a market’s sales or activity does this subject capture? | The commercial measure, such as revenue, units or even transactions, for example. |
A company can lead the conversation during an outage. Its mindshare may rise while sentiment falls, so neither movement is a reliable indication of the project gaining actual traction on the market and gaining customers.
How is mindshare calculated?
Mindshare is a share-based attention metric that divides the attention given to a specific topic by the total amount of attention that has been tracked for a particular group of topics and then multiplies it by 100.
Mindshare (%) = attention attributed to the subject ÷ total attention in the comparison group* × 100
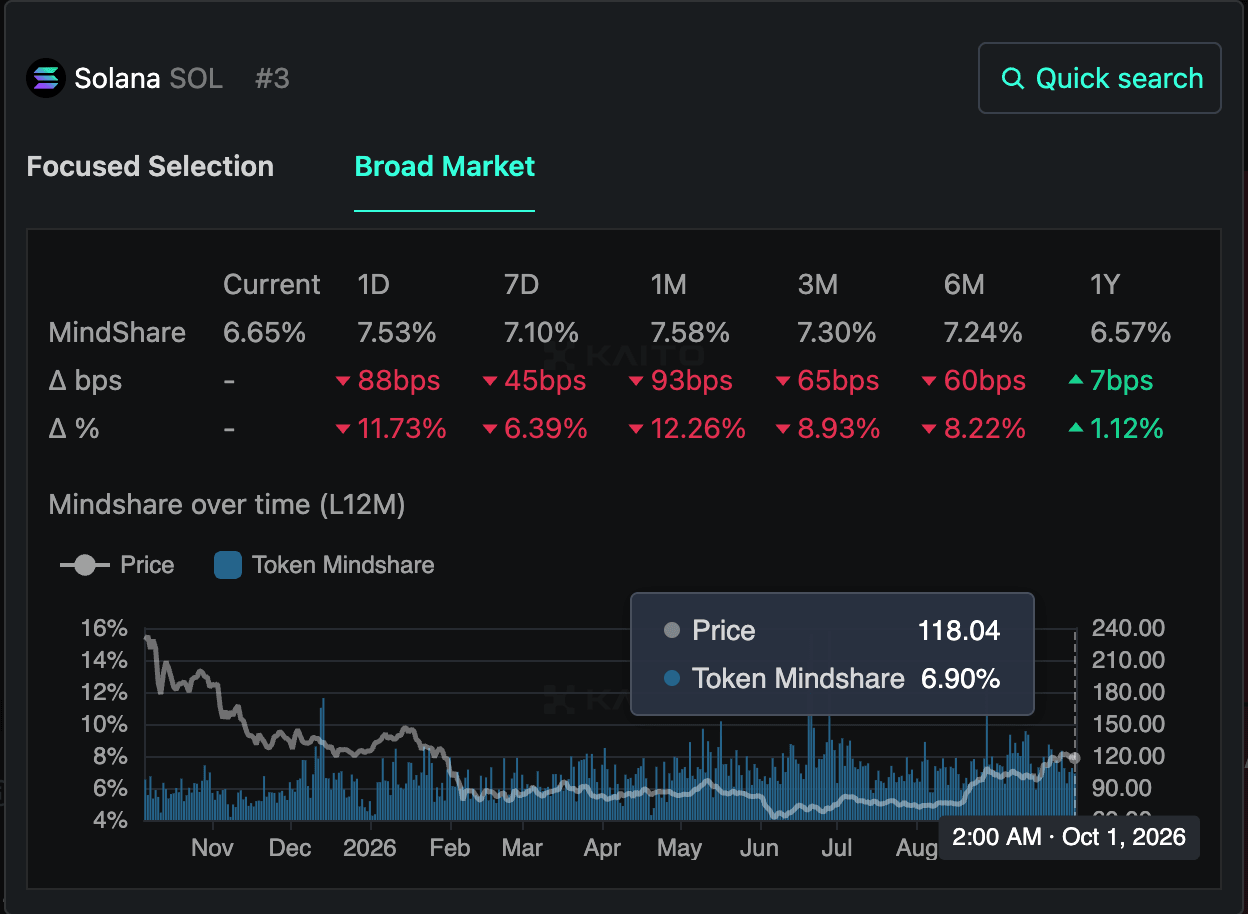
*In Kaito’s case, the comparison group is defined by its social graph – a map of accounts and the relationships between them, such as who follows, replies to and engages with whom., which maps accounts and the connections between them.
This equation is straightforward, and the variables used to enter into the equation will determine the interpretation of the results. A mention-based equation counts posts, while a weighted equation takes into consideration such factors as source relevance, contributor credibility or quality of engagement.
To have a valid comparison, you must identify four components:
- Comparison Group: NVIDIA’s share of discussion about tech stocks will differ from its share of discussion about all tracked stocks.
- Source Coverage: A specific type of metric (e.g. X-based) measures attention within its indexed X content. However, it cannot reflect every single conversation taking place on the Internet.
- Filter and Weighting: Determine how the service provider filters out spam, duplicate content, ambiguous names and contributor quality.
- Measurement Period: Compare similar time frames using the same filters. A single day after a product launch and a month-long average are two very different answers to two very different questions.
Can mentions increase while mindshare decreases?
Absolutely. A subject will experience a decrease in mindshare when its attention rate increases at a slower pace than the attention rate experienced by the comparison group.
For example, in the week of 14–20 September, Bitcoin was mentioned more often than the week before, yet its share of crypto conversation fell:
| Measurement | 7–13 Sep | 14–20 Sep | Difference |
|---|---|---|---|
| Bitcoin mentions | 6,358 | 6,721 | +5.7% |
| Bitcoin mindshare (daily average) | 9.75% | 8.37% | −1.38 percentage points (−14.1%) |
Bitcoin picked up 363 more mentions, but the rest of crypto sector simply grew faster.
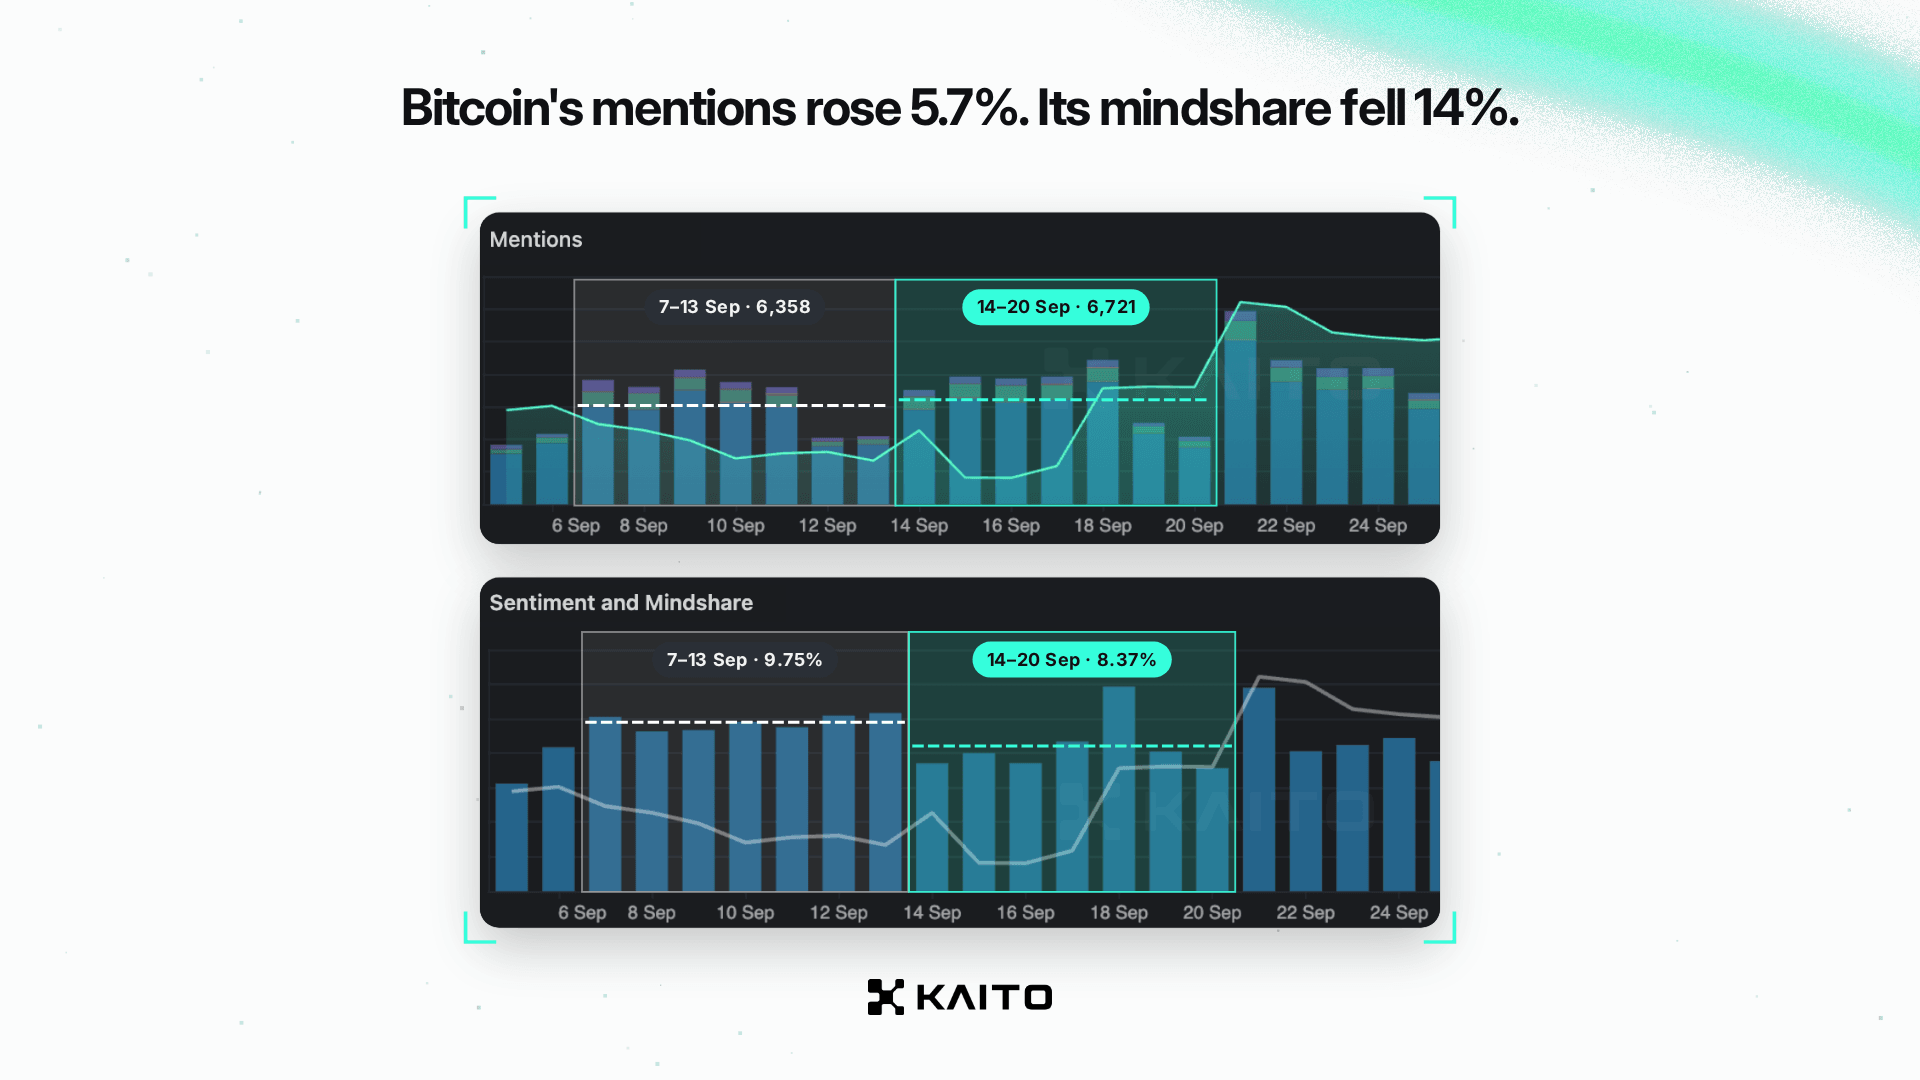
In the AI era, content creation volume saw a cataclysmic rise adding an additional level of noise to online conversations. Mentions are rising due to this increased production of content and not necessarily because there is more interest in the topic. By looking at who is creating these posts and what their post says, one can better understand why the mention count is increasing.
Why do you need to measure attention beyond mention counts?
Mention counts provide valuable insight regarding activity levels. However, they consider each mention that matches the search criteria as another unit of volume. They fail to determine if the discussion is relevant, independent or reaching the target audience.
A product launch may result in multiple announcements from affiliated accounts. On the other hand, technical analysis may result in fewer posts. However, these posts may draw detailed responses from developers and/or customers. The point is – neither of these scenarios can be explained solely by the count of posts.
When analyzing an attention spike, each of the following areas should be taken into consideration:
- Relevance: Is the audience discussing the intended company, token or topic?
- Breadth: Is the conversation occurring across multiple independent accounts or is it concentrated within a single group?
- Substance: Are contributors providing analysis and/or experience-based commentary or simply reiterating a previously stated claim?
- Persistence: Does discussion continue beyond the conclusion of the announcement or campaign?
Weighting based on credibility and spam filters can assist in accounting for these differences. The value provided by these features depends on how they were developed and maintained; therefore, a weighted score requires additional context.
How do you track crypto mindshare?
Monitor crypto mindshare at both the project and narrative levels. Project-level data identifies which digital assets are receiving attention. Narrative-level data illustrates how discussion is shifting among various themes.
Kaito Pro’s documented features include Token Mindshare for market and sector comparisons, and Narrative Mindshare for tracking changes between themes.
| Research Question | View to Use | Next Steps |
|---|---|---|
| Is this project gaining attention against competitors? | Project or token mindshare | Compare the same competitor group over the same timeframe |
| Is interest growing across the sector? | Narrative mindshare | Determine if interest is widespread or concentrated among a limited number of projects |
| What caused the change? | Search and underlying coverage | Review announcements, analysis and community feedback |
| How are people reacting? | Sentiment | Review comments made by users, putting aside the numeric value |
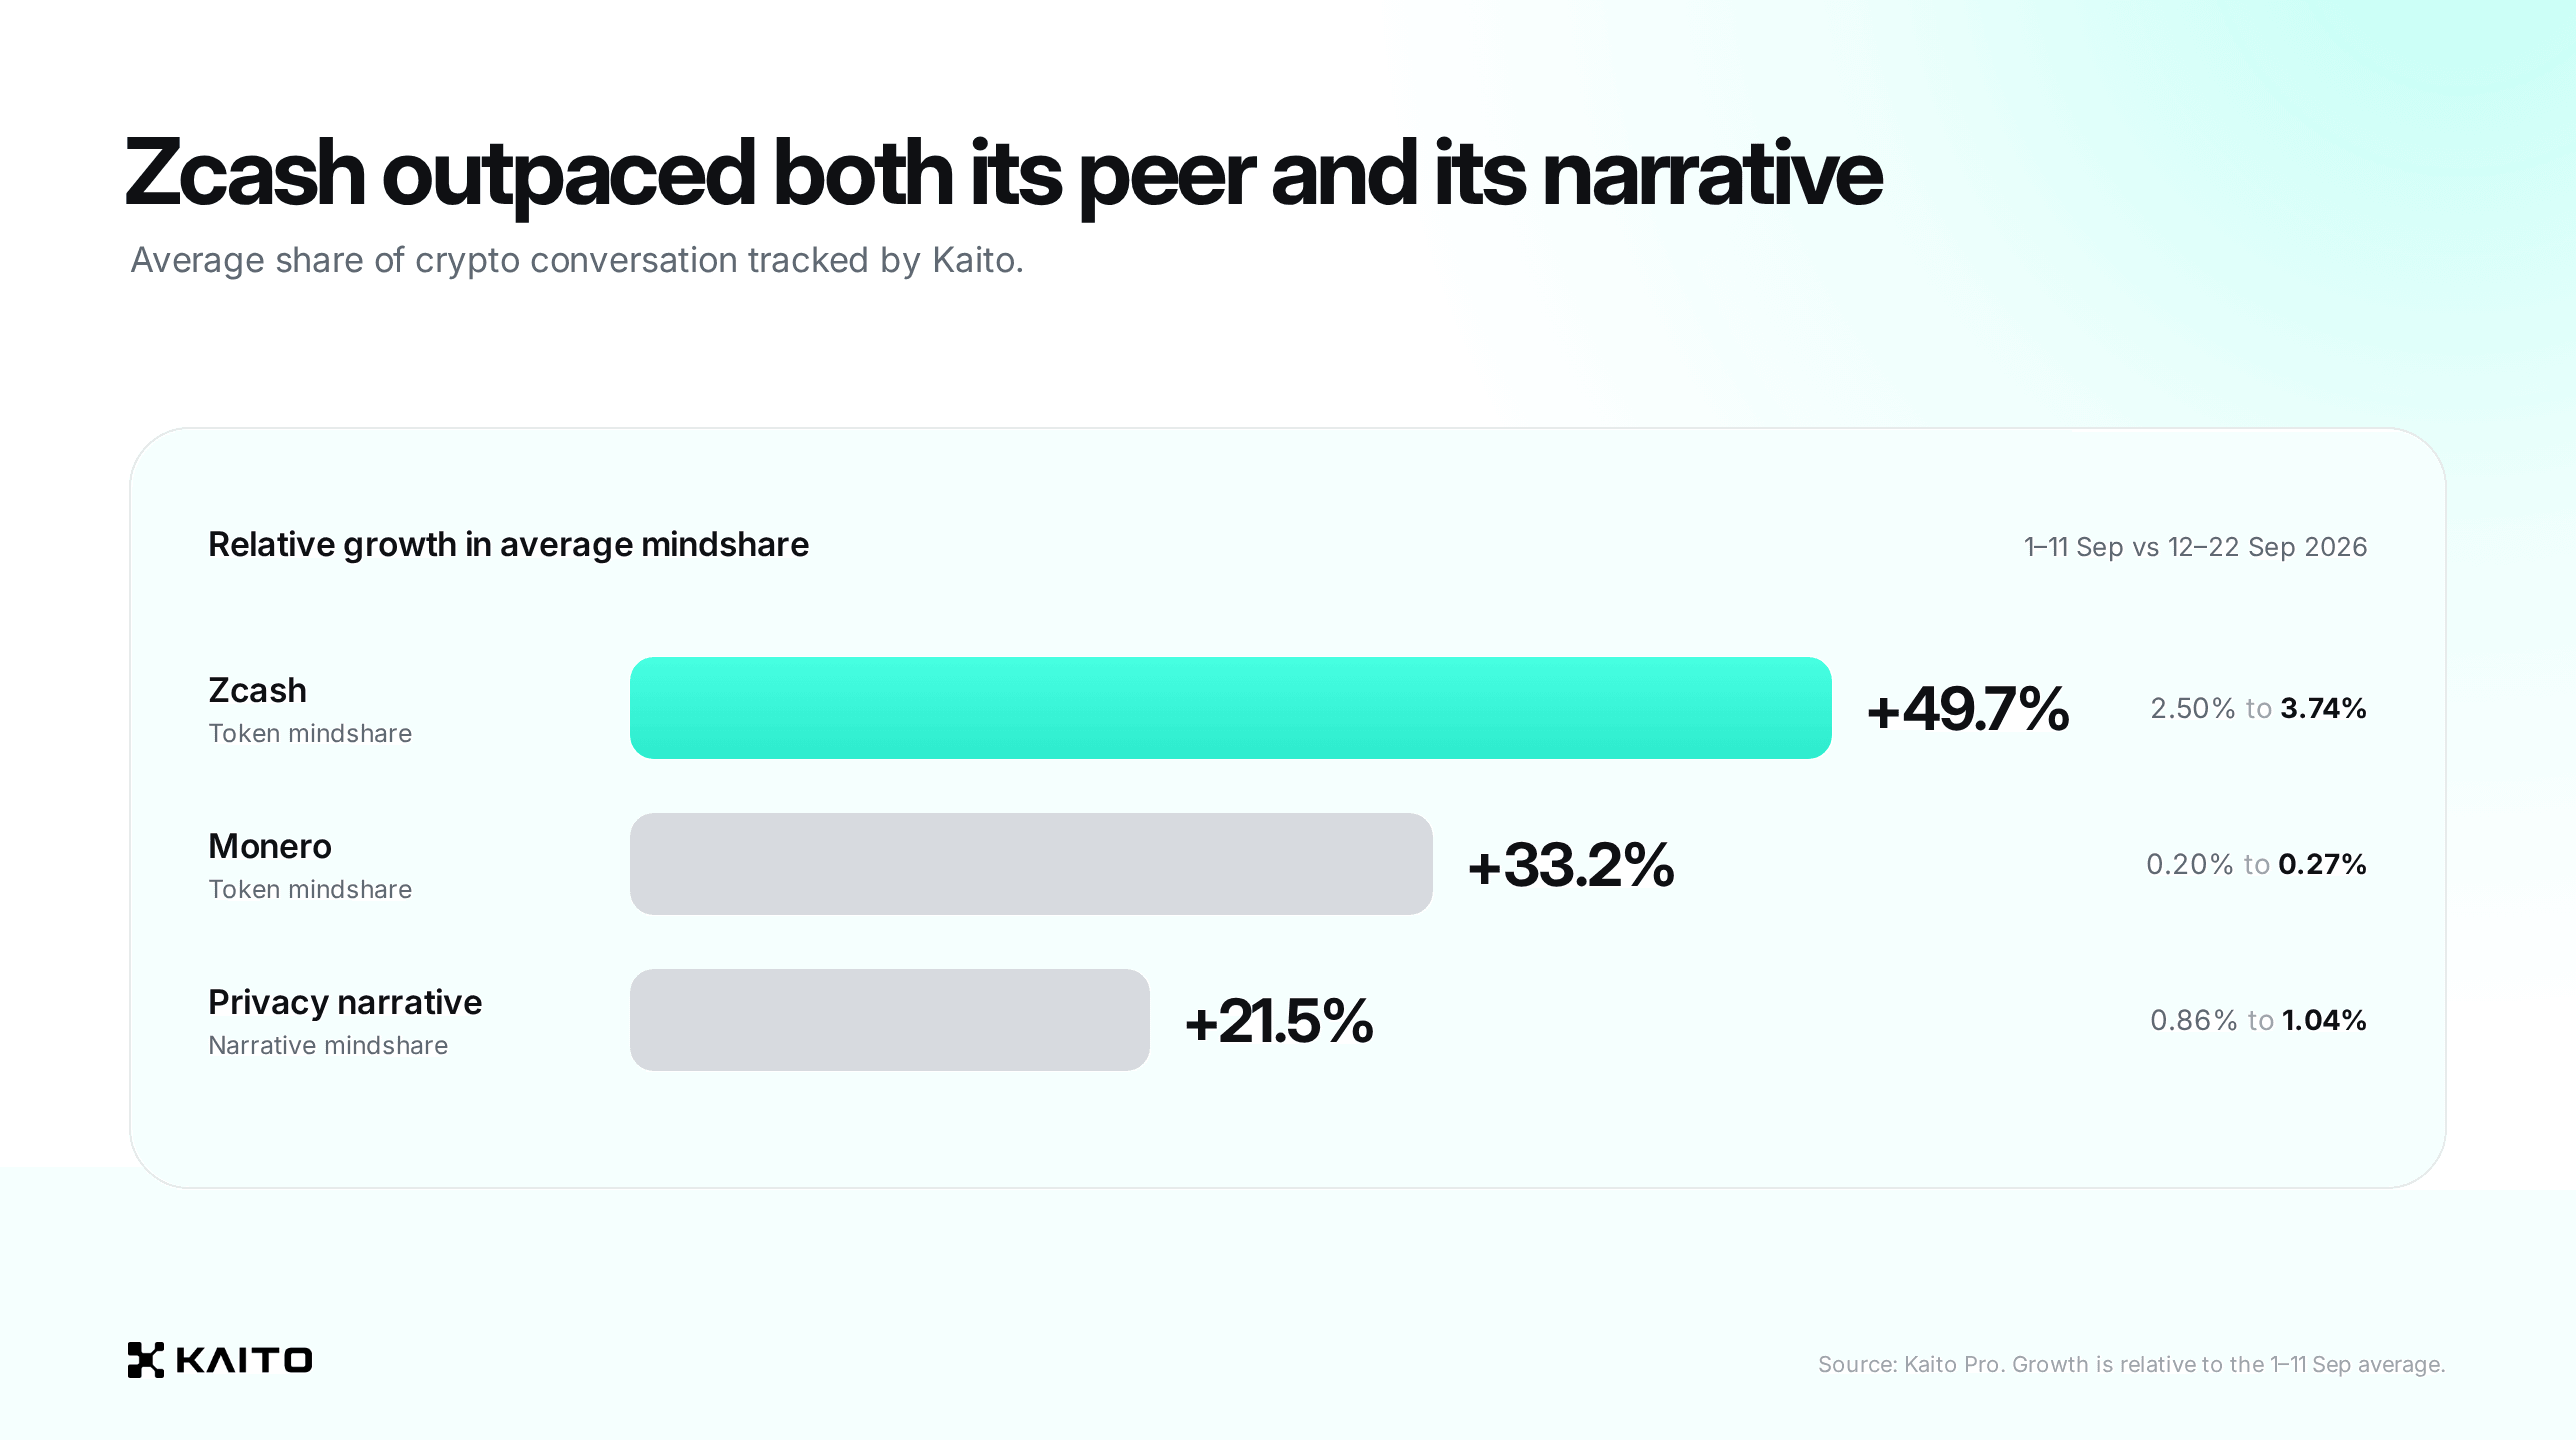
Zcash offers a useful example. Kaito data shows its average token mindshare rose from 2.50% to 3.74% between 1–11 and 12–22 September 2026, an increase of roughly 50%.
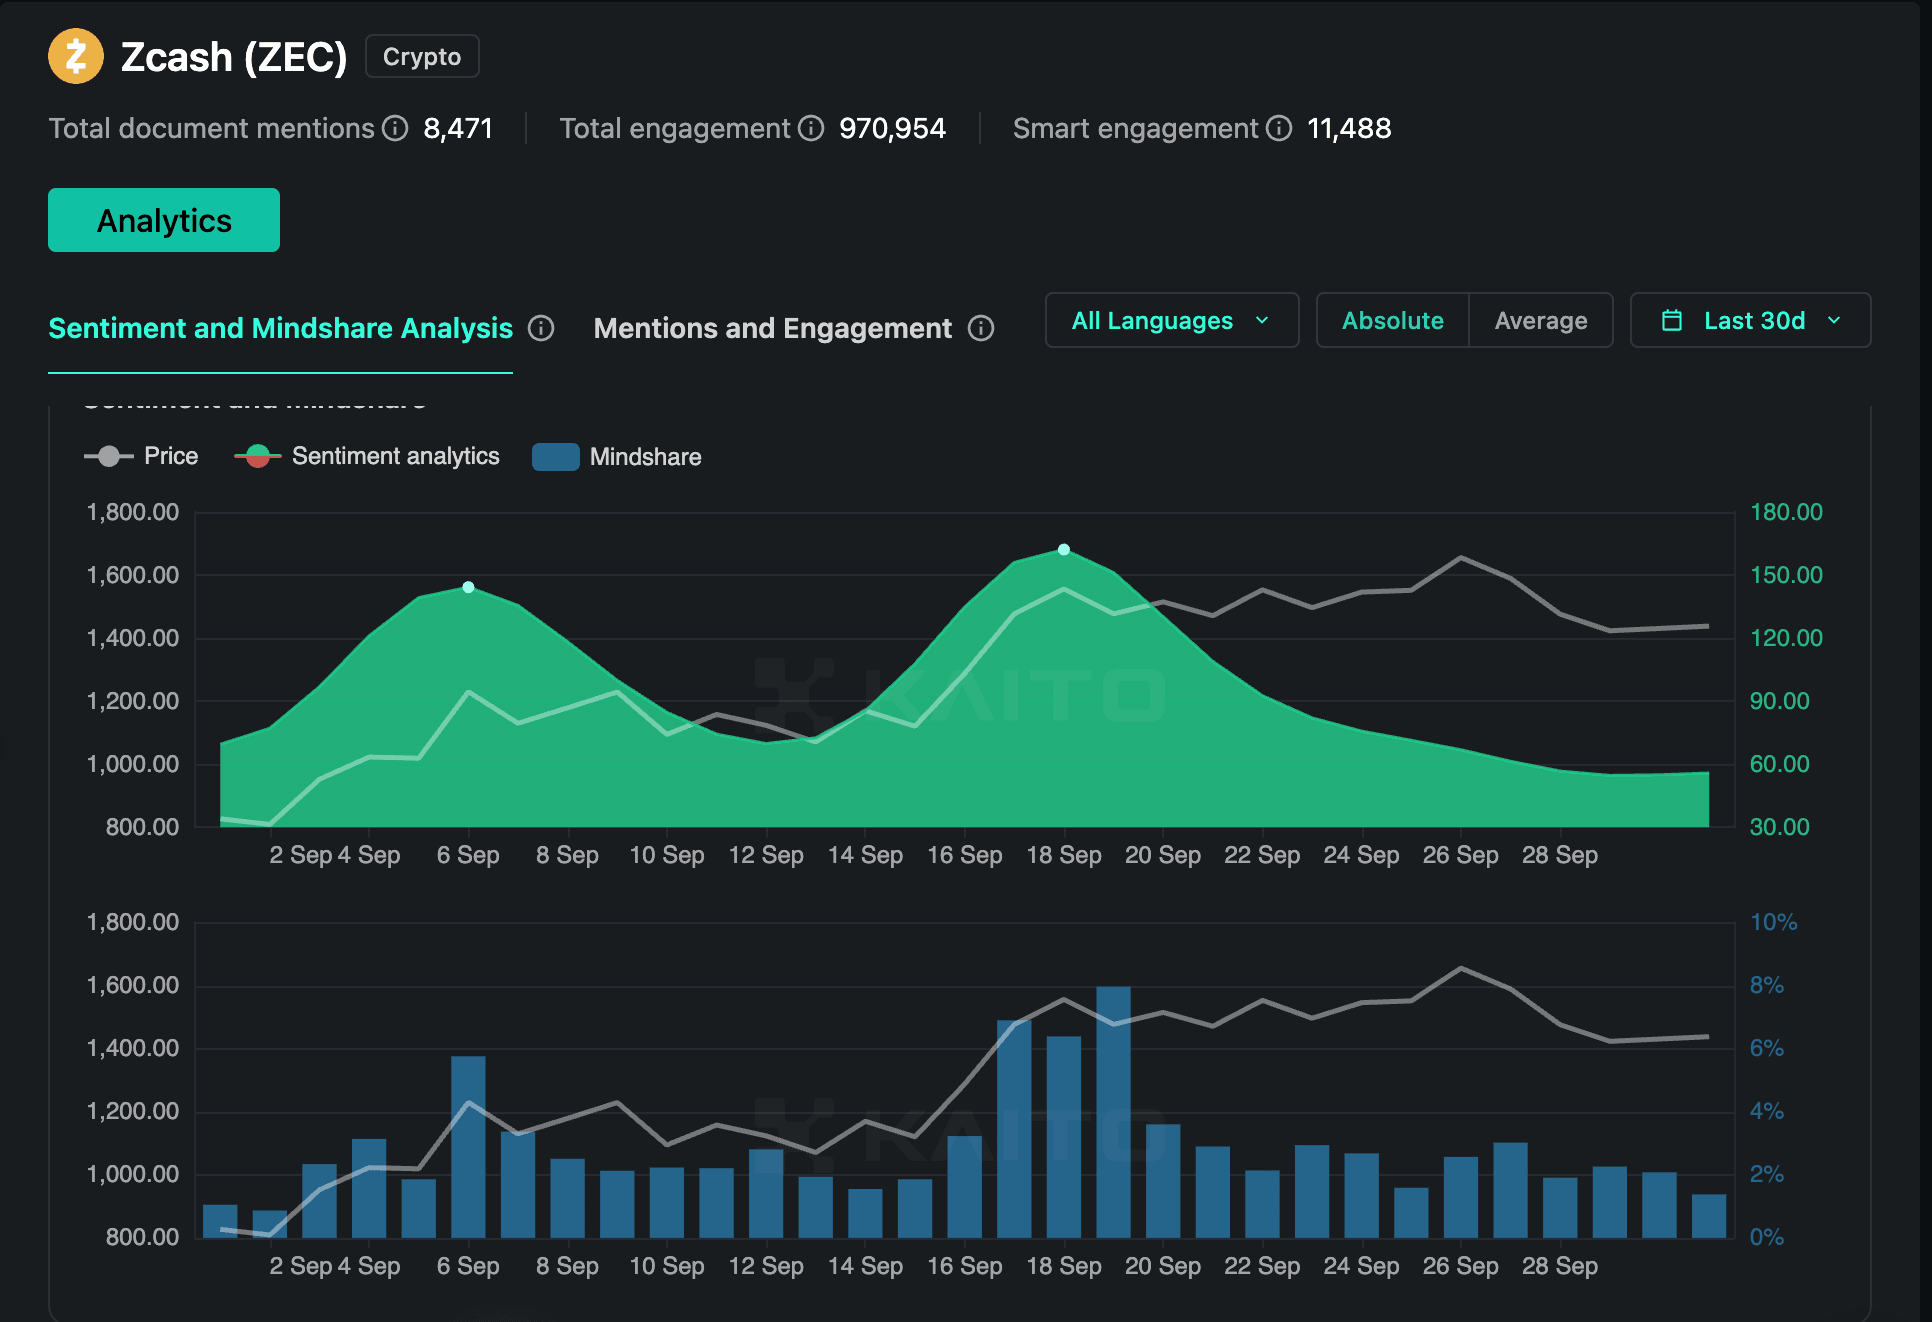
Over the same periods, Monero’s mindshare grew by around 33%, while the privacy narrative’s mindshare increased by around 22%.
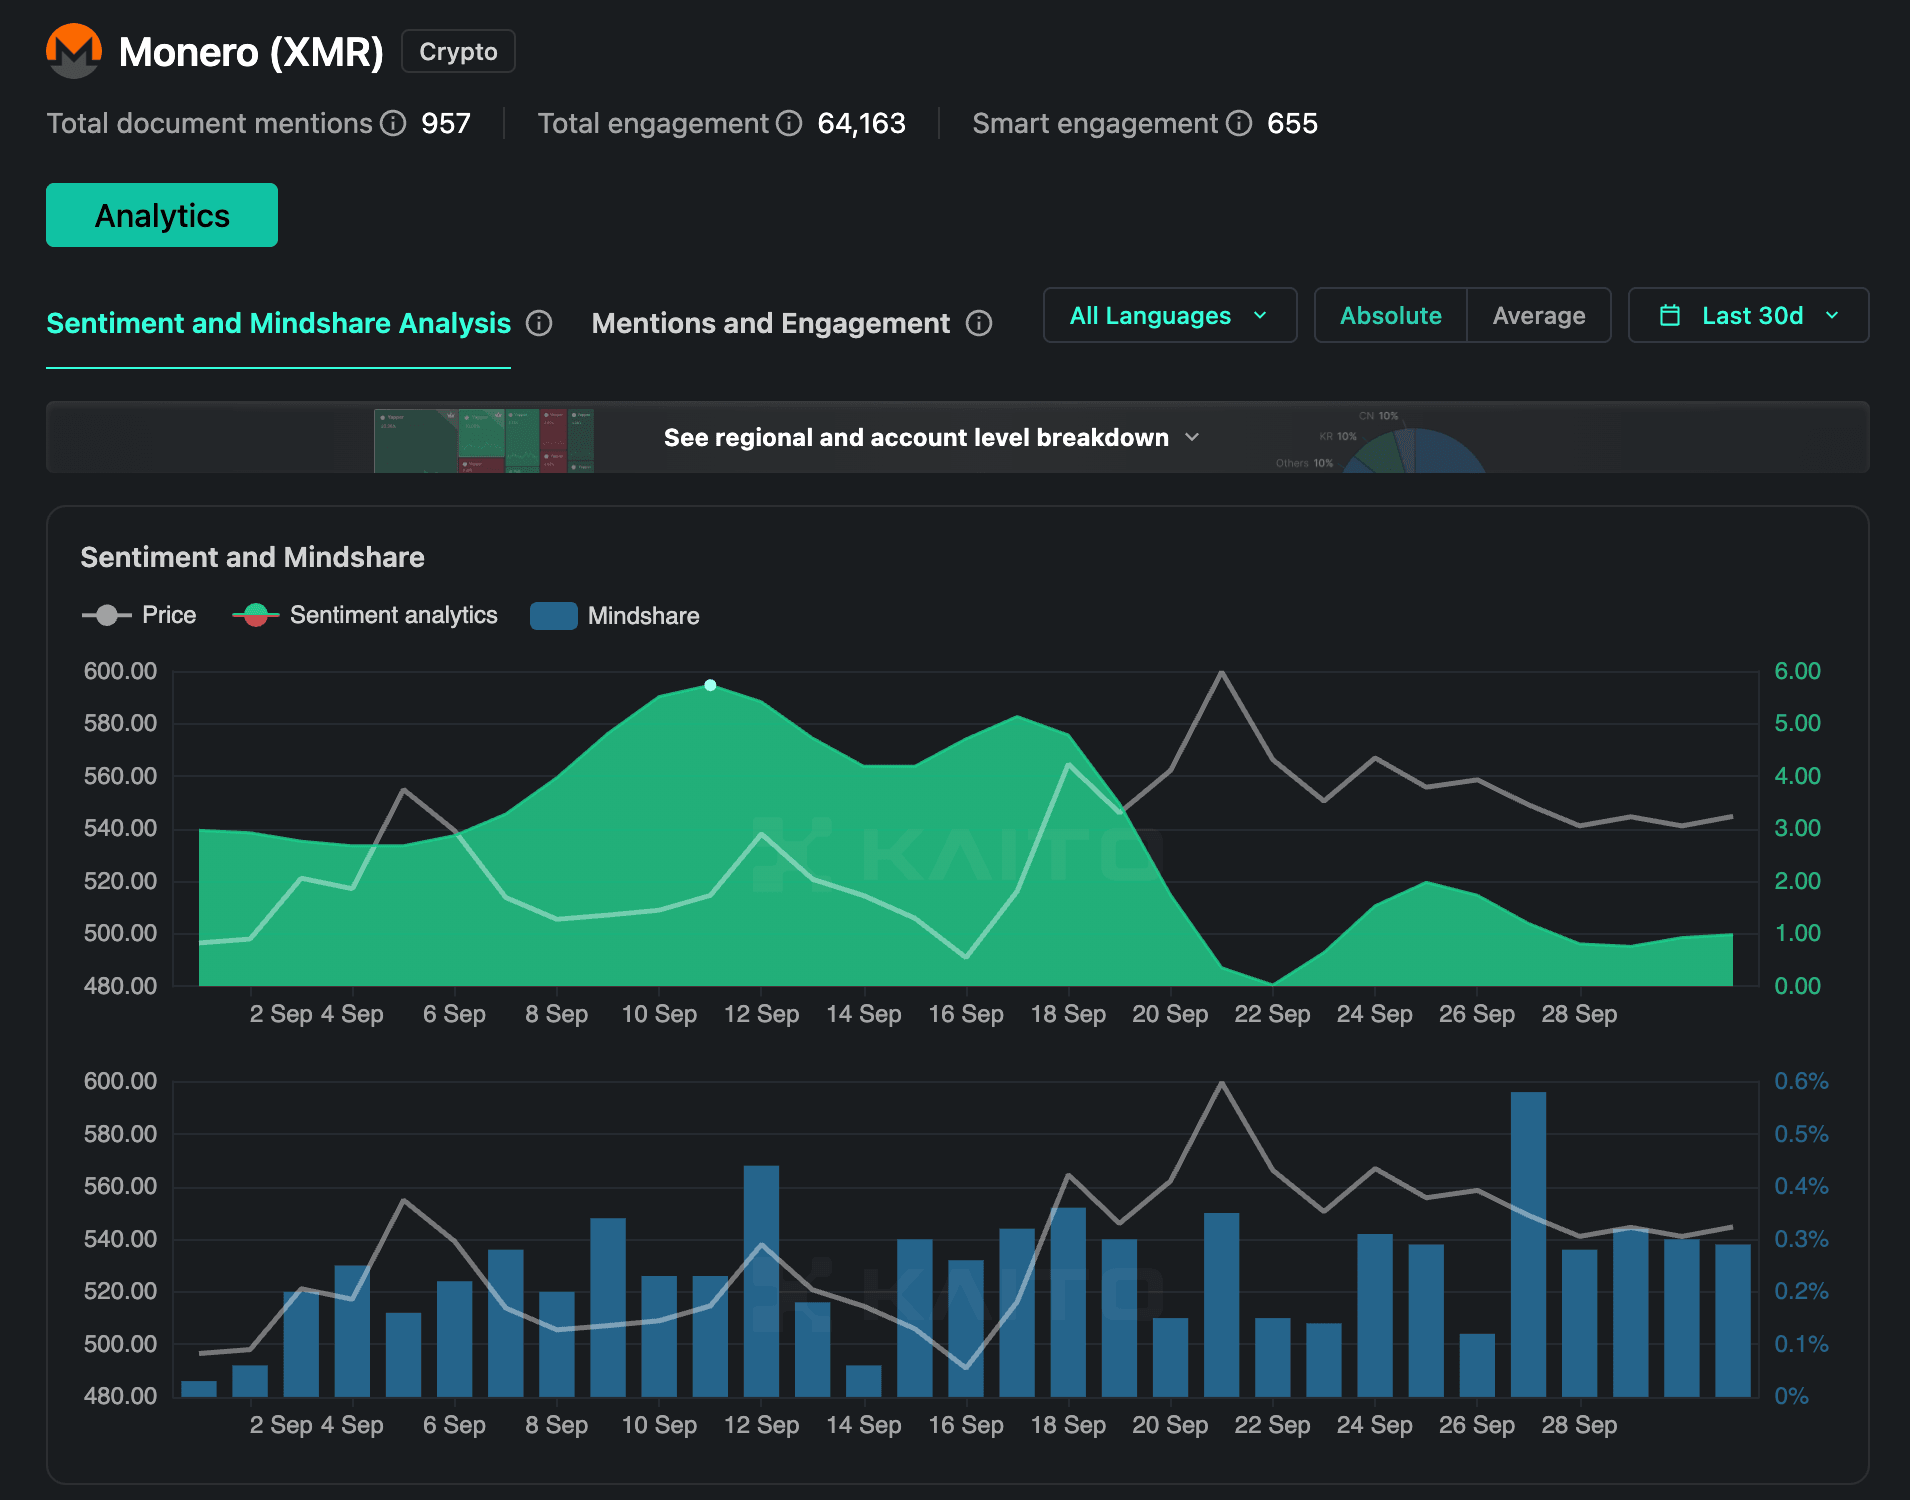
Looking at Zcash alone would miss that broader interest in privacy. Comparing it with Monero shows that Zcash also gained attention faster than a relevant peer. This gives you more context for investigating the move, though it doesn’t establish what caused it.
Arc serves as another useful example of how attention can help you research a project before it has a token price. Circle’s Layer 1 launched its mainnet on 16 September 2026 using USDC for gas, without a native token of its own.
Kaito data shows Arc averaged 0.13% of tracked crypto conversation during the baseline period. Its mindshare increased in the days before launch and reached 6.23% on launch day.
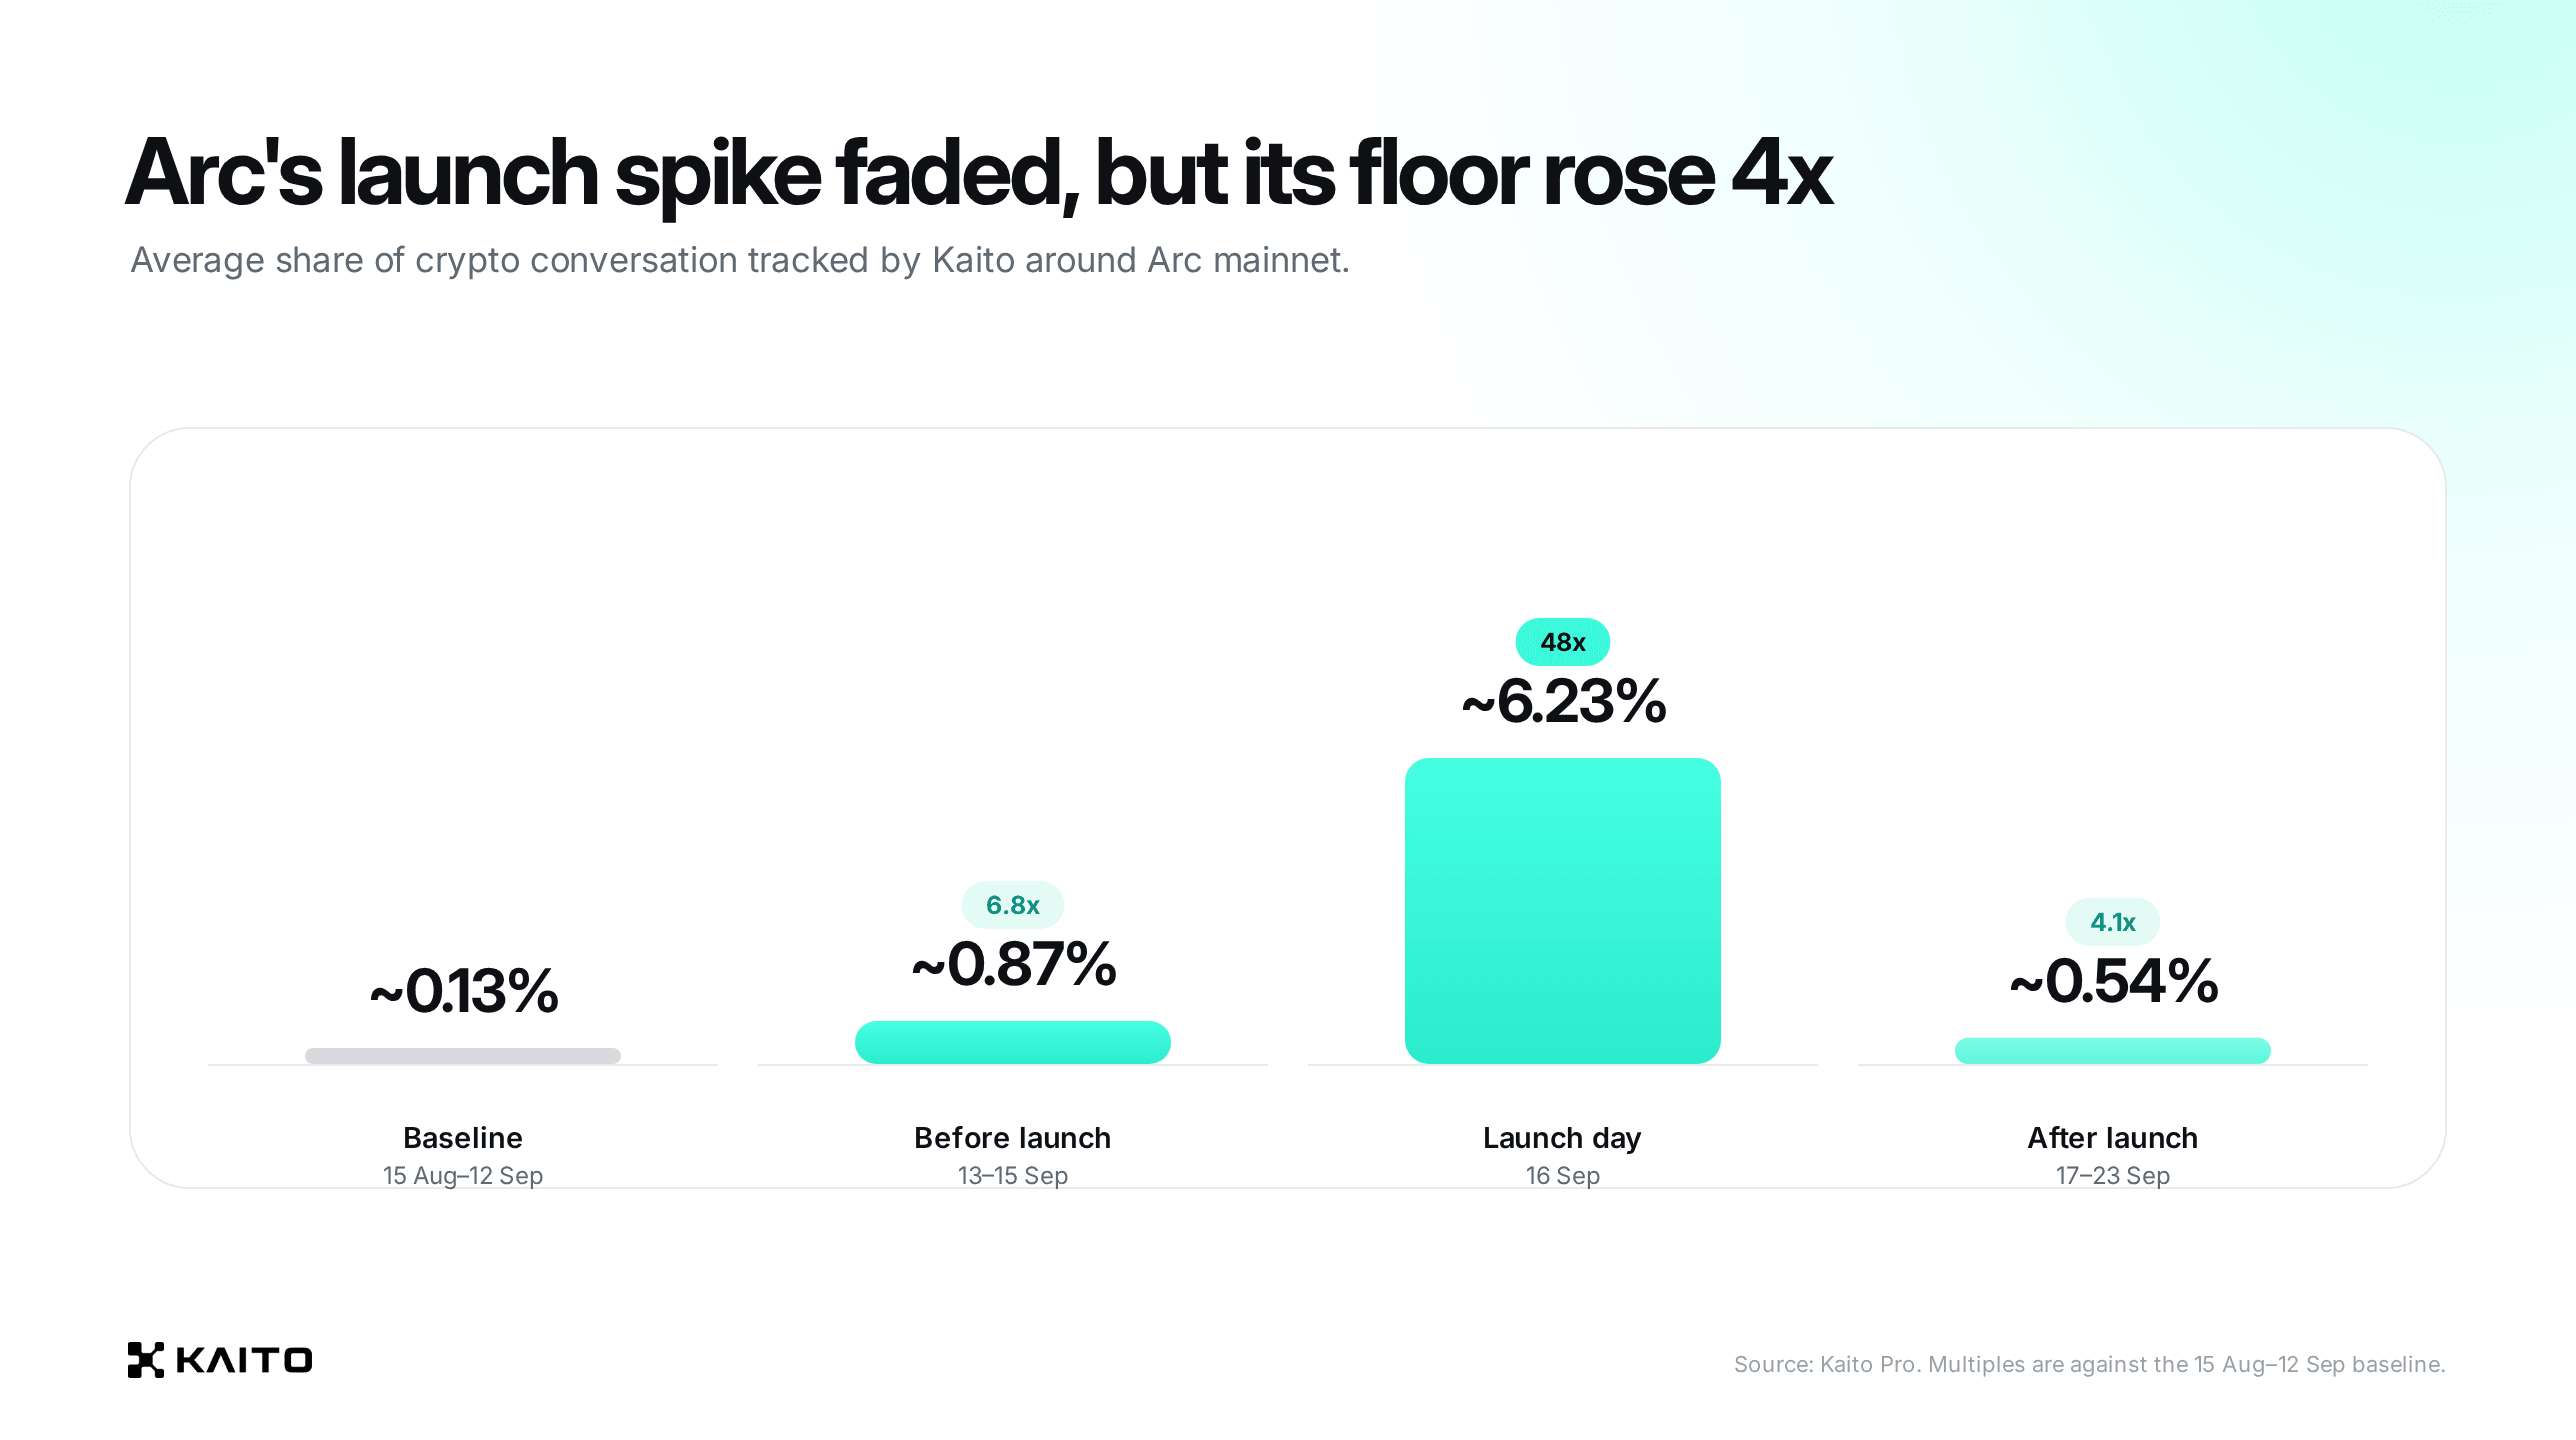
The spike faded quickly, but the post-launch average was still roughly four times the baseline. Following those readings helps you distinguish a brief launch-day surge from attention that continues afterwards. You can then investigate that interest alongside product progress and actual usage.
The comparison group also changes the picture. For the week ending 23 September, Arc ranked first among 89 tracked pre-TGE projects with 24.81% mindshare.
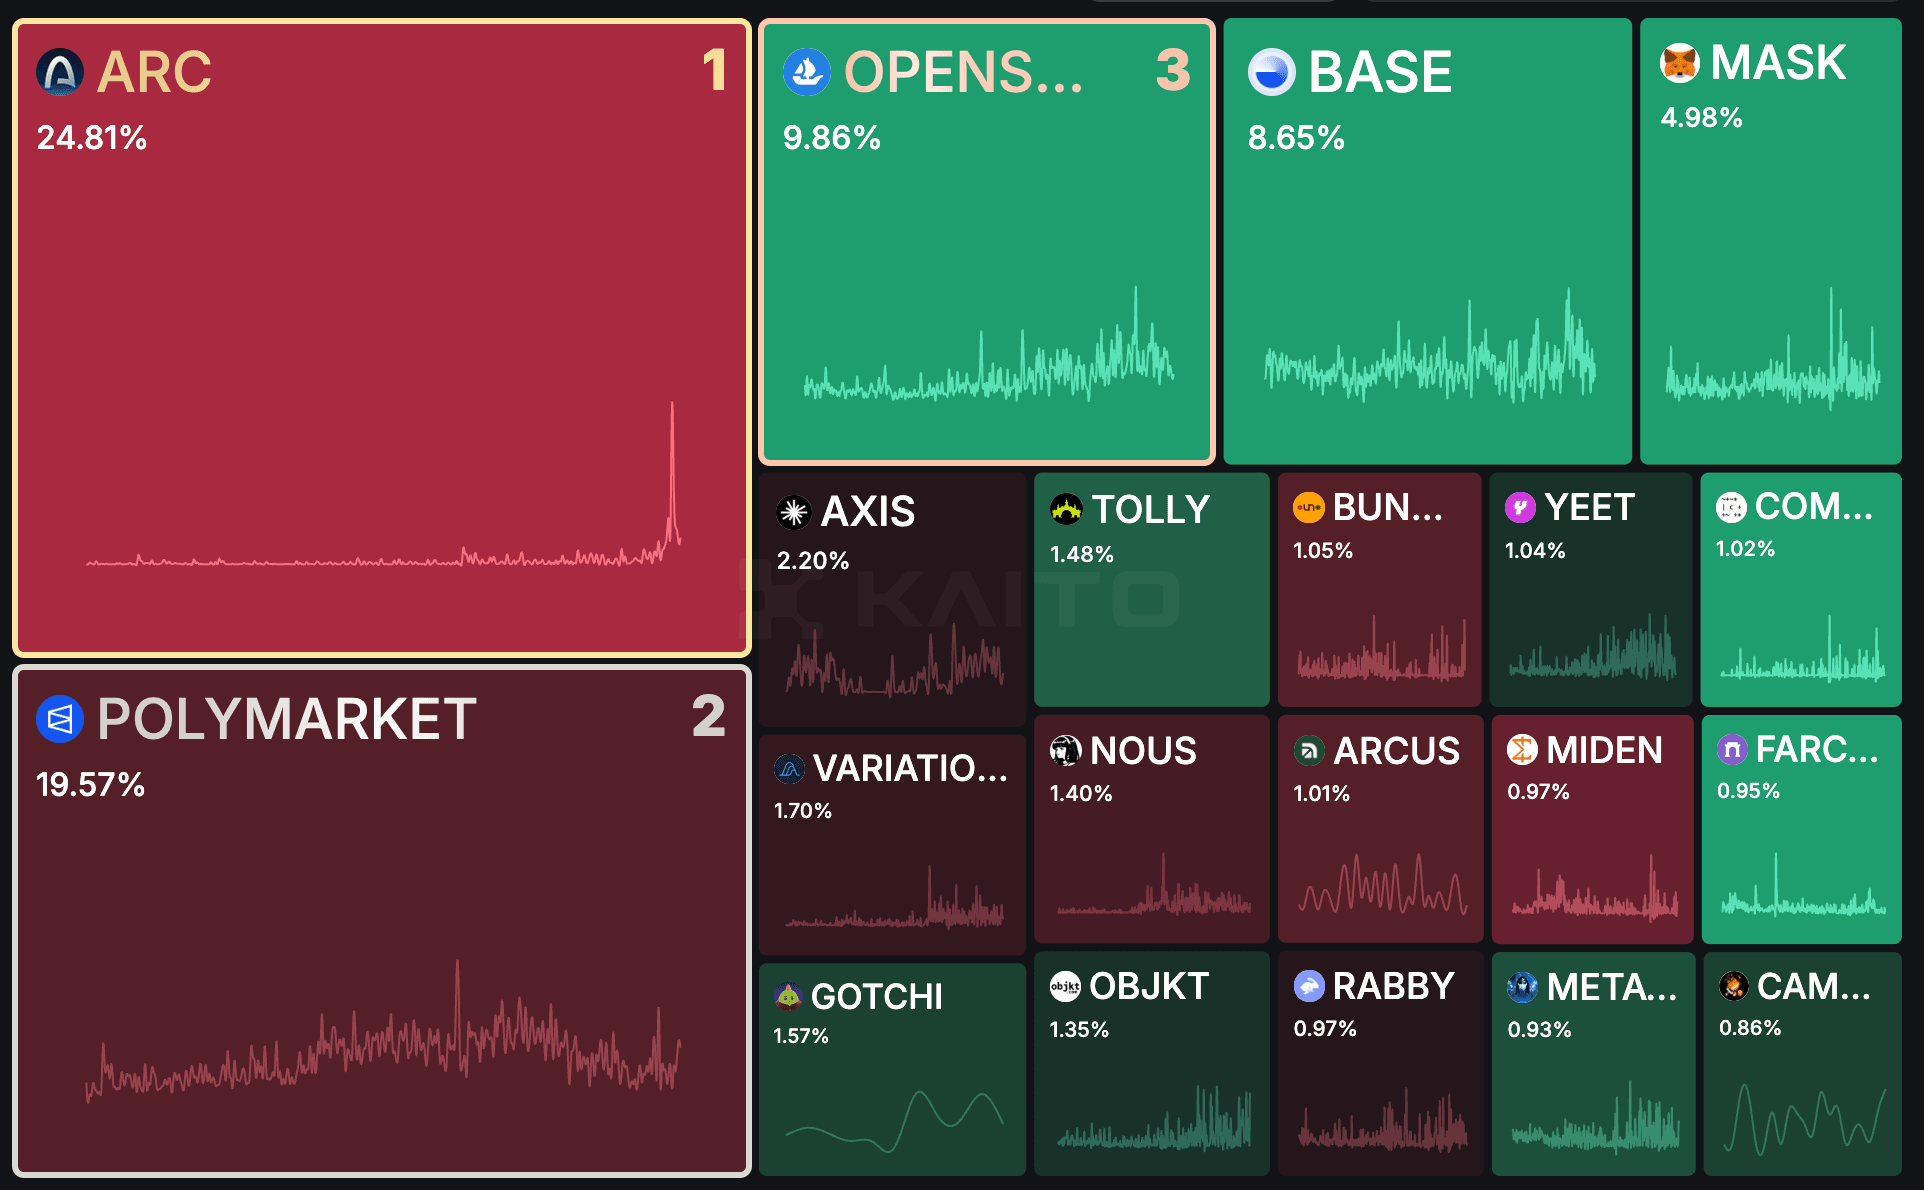
Against overall tracked crypto conversation, its reading was 0.58%. The first shows its position among pre-TGE peers, while the second puts that attention in a broader market context.
How do you measure mindshare for stocks and AI companies?
Establish a relevant company group and a consistent time frame for evaluation. Kaito’s Top Companies Mindshare Arena includes stock trading, AI and crypto. It offers a starting point for assessing attention across these markets.
For stocks, compare companies within a sector when attempting to assess competitive visibility. An earnings release can dominate a company’s discussion for a day without altering its long-term position. Examine both the event window and the surrounding period. For AI companies, select peers that align with your research question. Model developers, chipmakers and application companies may participate in AI-related discussions while competing for different customers.
Below is a useful starting framework you can apply.
| Market | Comparison That Works Best | Context to Evaluate |
|---|---|---|
| Crypto | Projects in the same sector or narrative | Launches, protocol changes, governance and community activity |
| Stocks | Companies in a sector or selected peer group | Earnings, product announcements and company news |
| AI | Companies serving similar users or technical needs | Model releases, benchmarks, pricing and developer response |
Namely, Apple’s September 2026 Product Event demonstrates how attention, amount of conversation created and how people feel about what they’re saying can vary. Kaito Data reports that the amount of time people talked about Apple on social media increased significantly after the event.
The percentage of total conversations about companies that were about Apple increased from an average of 0.75 percent in the week prior to the event to 1.44 percent in the week following. On September 9th, when the event took place, the amount of conversation about Apple reached 6.49 percent. This is nearly nine times higher than the week before.
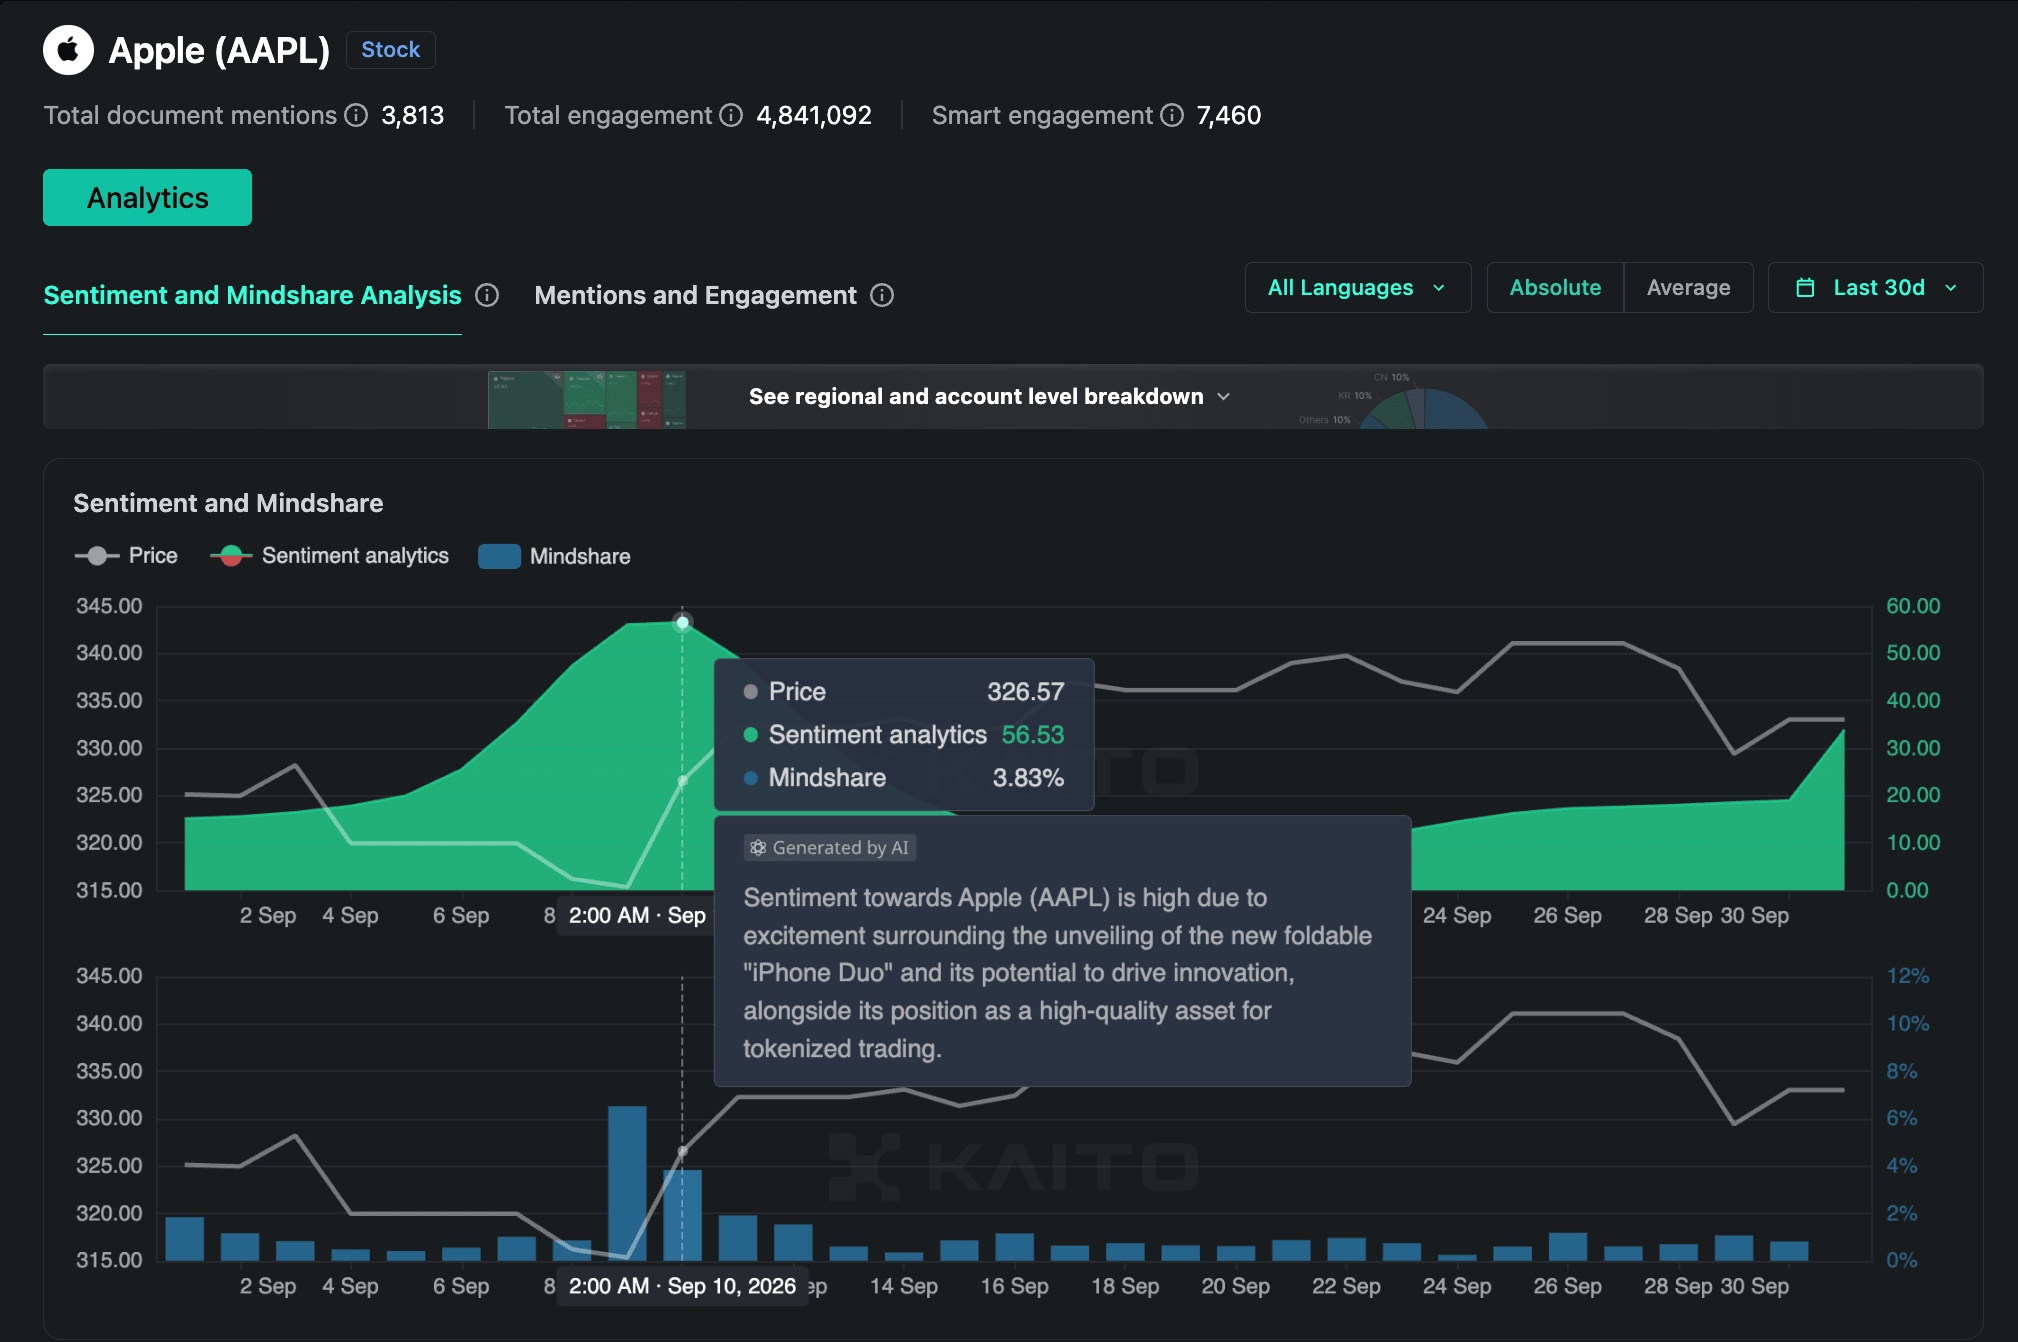
However, although there was more conversation about Apple after the event, there was less of an increase in the number of times people mentioned Apple on social media. The number of mentions of Apple per day increased from an average of 91 to 117.
| * Apple ($AAPL) | 7 days before 2–8 Sep 2026 | 7 days after 10–16 Sep 2026 | Change |
|---|---|---|---|
| Mindshare (share of tracked equity conversation) | 0.75% | 1.44% | +0.68 pp / +90% |
| Mentions per day | 91 | 117 | +29% |
| Average sentiment (−1 to +1) | 0.17 | 0.13 | −26% |
| Event day, 9 Sep | – | – | 6.49% mindshare, 429 mentions |
The attention that Apple received following the event was very short-lived. By September 13th, the amount of conversation about Apple per day had returned to its pre-event level. For the period of September 17th - 21st, the average amount of conversation about Apple per day was slightly lower than it was prior to the event. If you only looked at the post-event weekly averages for attention levels, you might think that Apple continued to generate higher-than-normal levels of attention.
If you examined the daily attention readings for Apple, you would see that the spike in attention had already subsided. Similarly, if you looked at sentiment scores along with attention levels, you would see that the increase in attention did not result in a more positive conversation.
*Source: Kaito Pro data, retrieved on October 1st, 2026. Data presented represents averages of daily readings for Apple (AAPL), as compared to Kaito’s tracked equity conversation. Previous readings may be updated over time; all readings presented here are based upon the retrieval date of October 1st, 2026
How do you use Kaito to investigate a mindshare change?
Use Kaito’s Mindshare Arena to compare attention across companies or voices, then investigate the discussion behind a change. Start by choosing the right view: a company ranking helps you research an entity, while a voice ranking helps you explore the accounts participating in a market’s conversation.
What is Kaito’s Mindshare Arena?
Mindshare Arena is Kaito’s public interface for exploring attention leaderboards. It has two main views, Top Companies and Top Voices, with categories covering stocks, AI and crypto.
A company can attract attention after a product announcement. An analyst can attract attention through their commentary on that announcement. Those are different subjects, so their rankings answer different research questions.
Top Companies includes Stock Trading Companies, AI Companies and Crypto Companies. In the stock view, Post-IPO covers publicly listed companies, while Pre-IPO focuses on companies before a public listing.
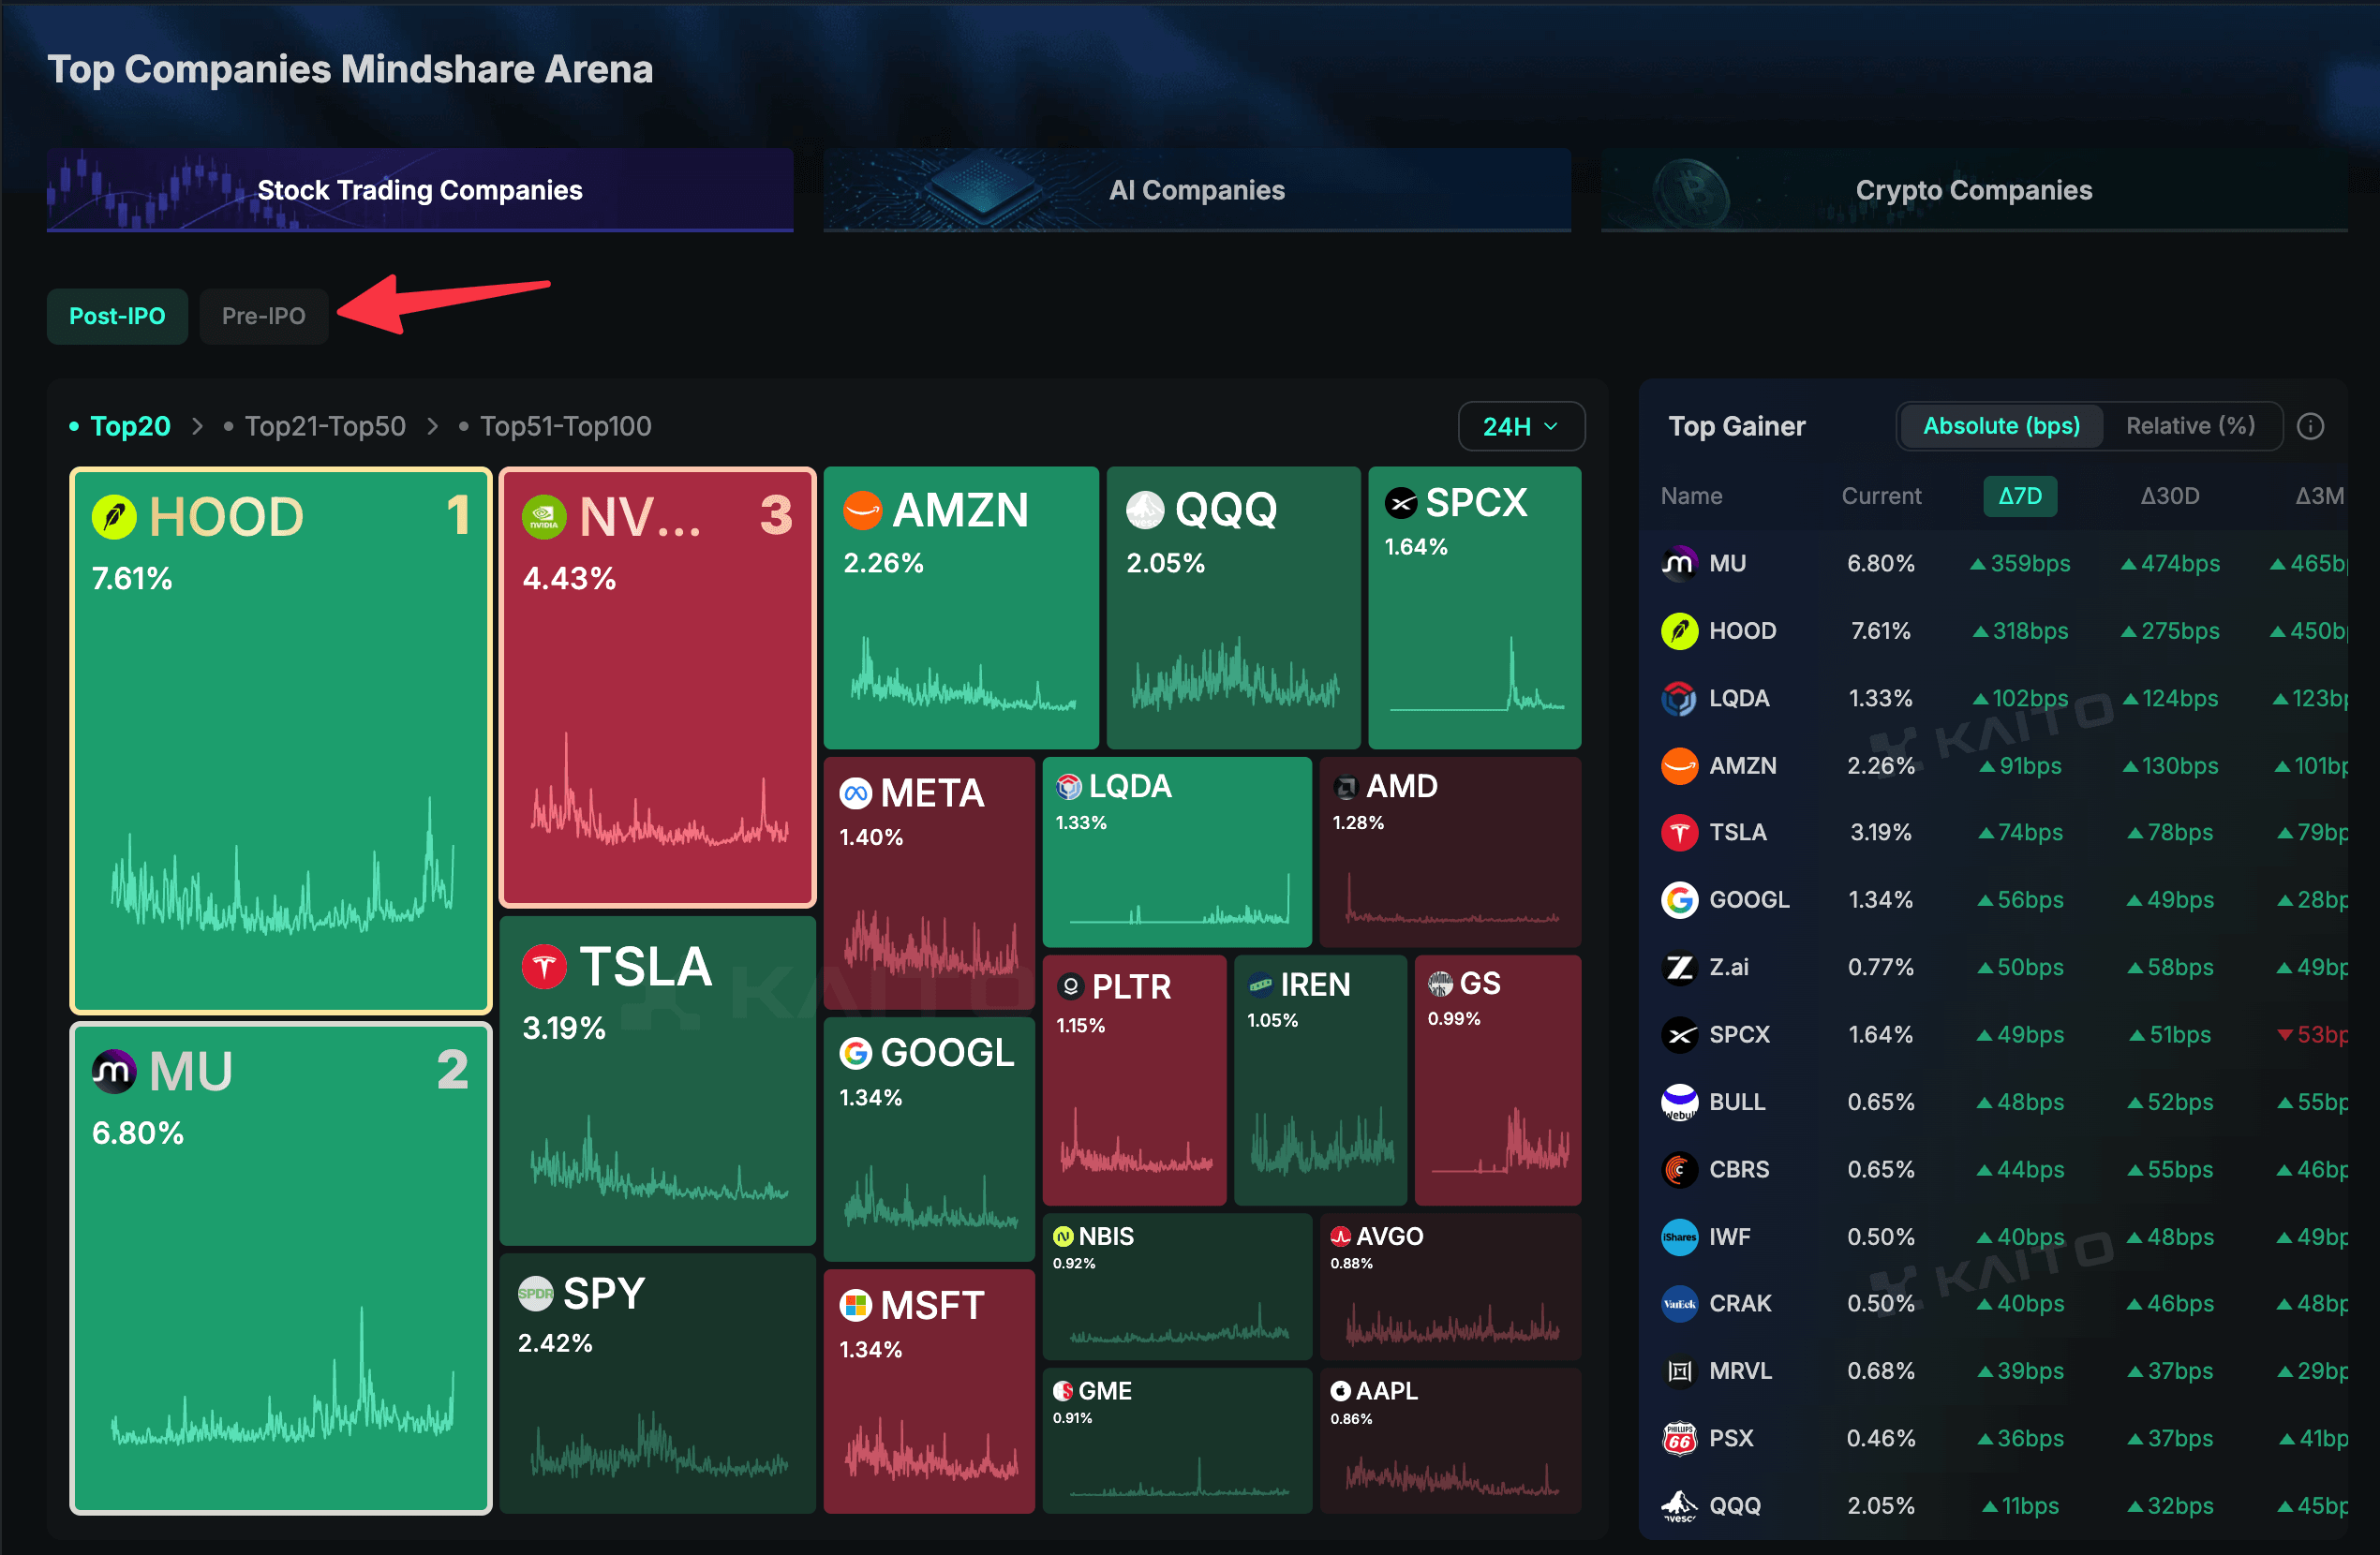
This lets you explore attention around a private company even when there is no publicly traded share price to compare it with.
In the AI view, categories include Foundation Models, Coding Agents and Image Generation. It also separates Video Gen Models from Video Gen Apps, alongside categories such as Robotics and Vibe Apps.
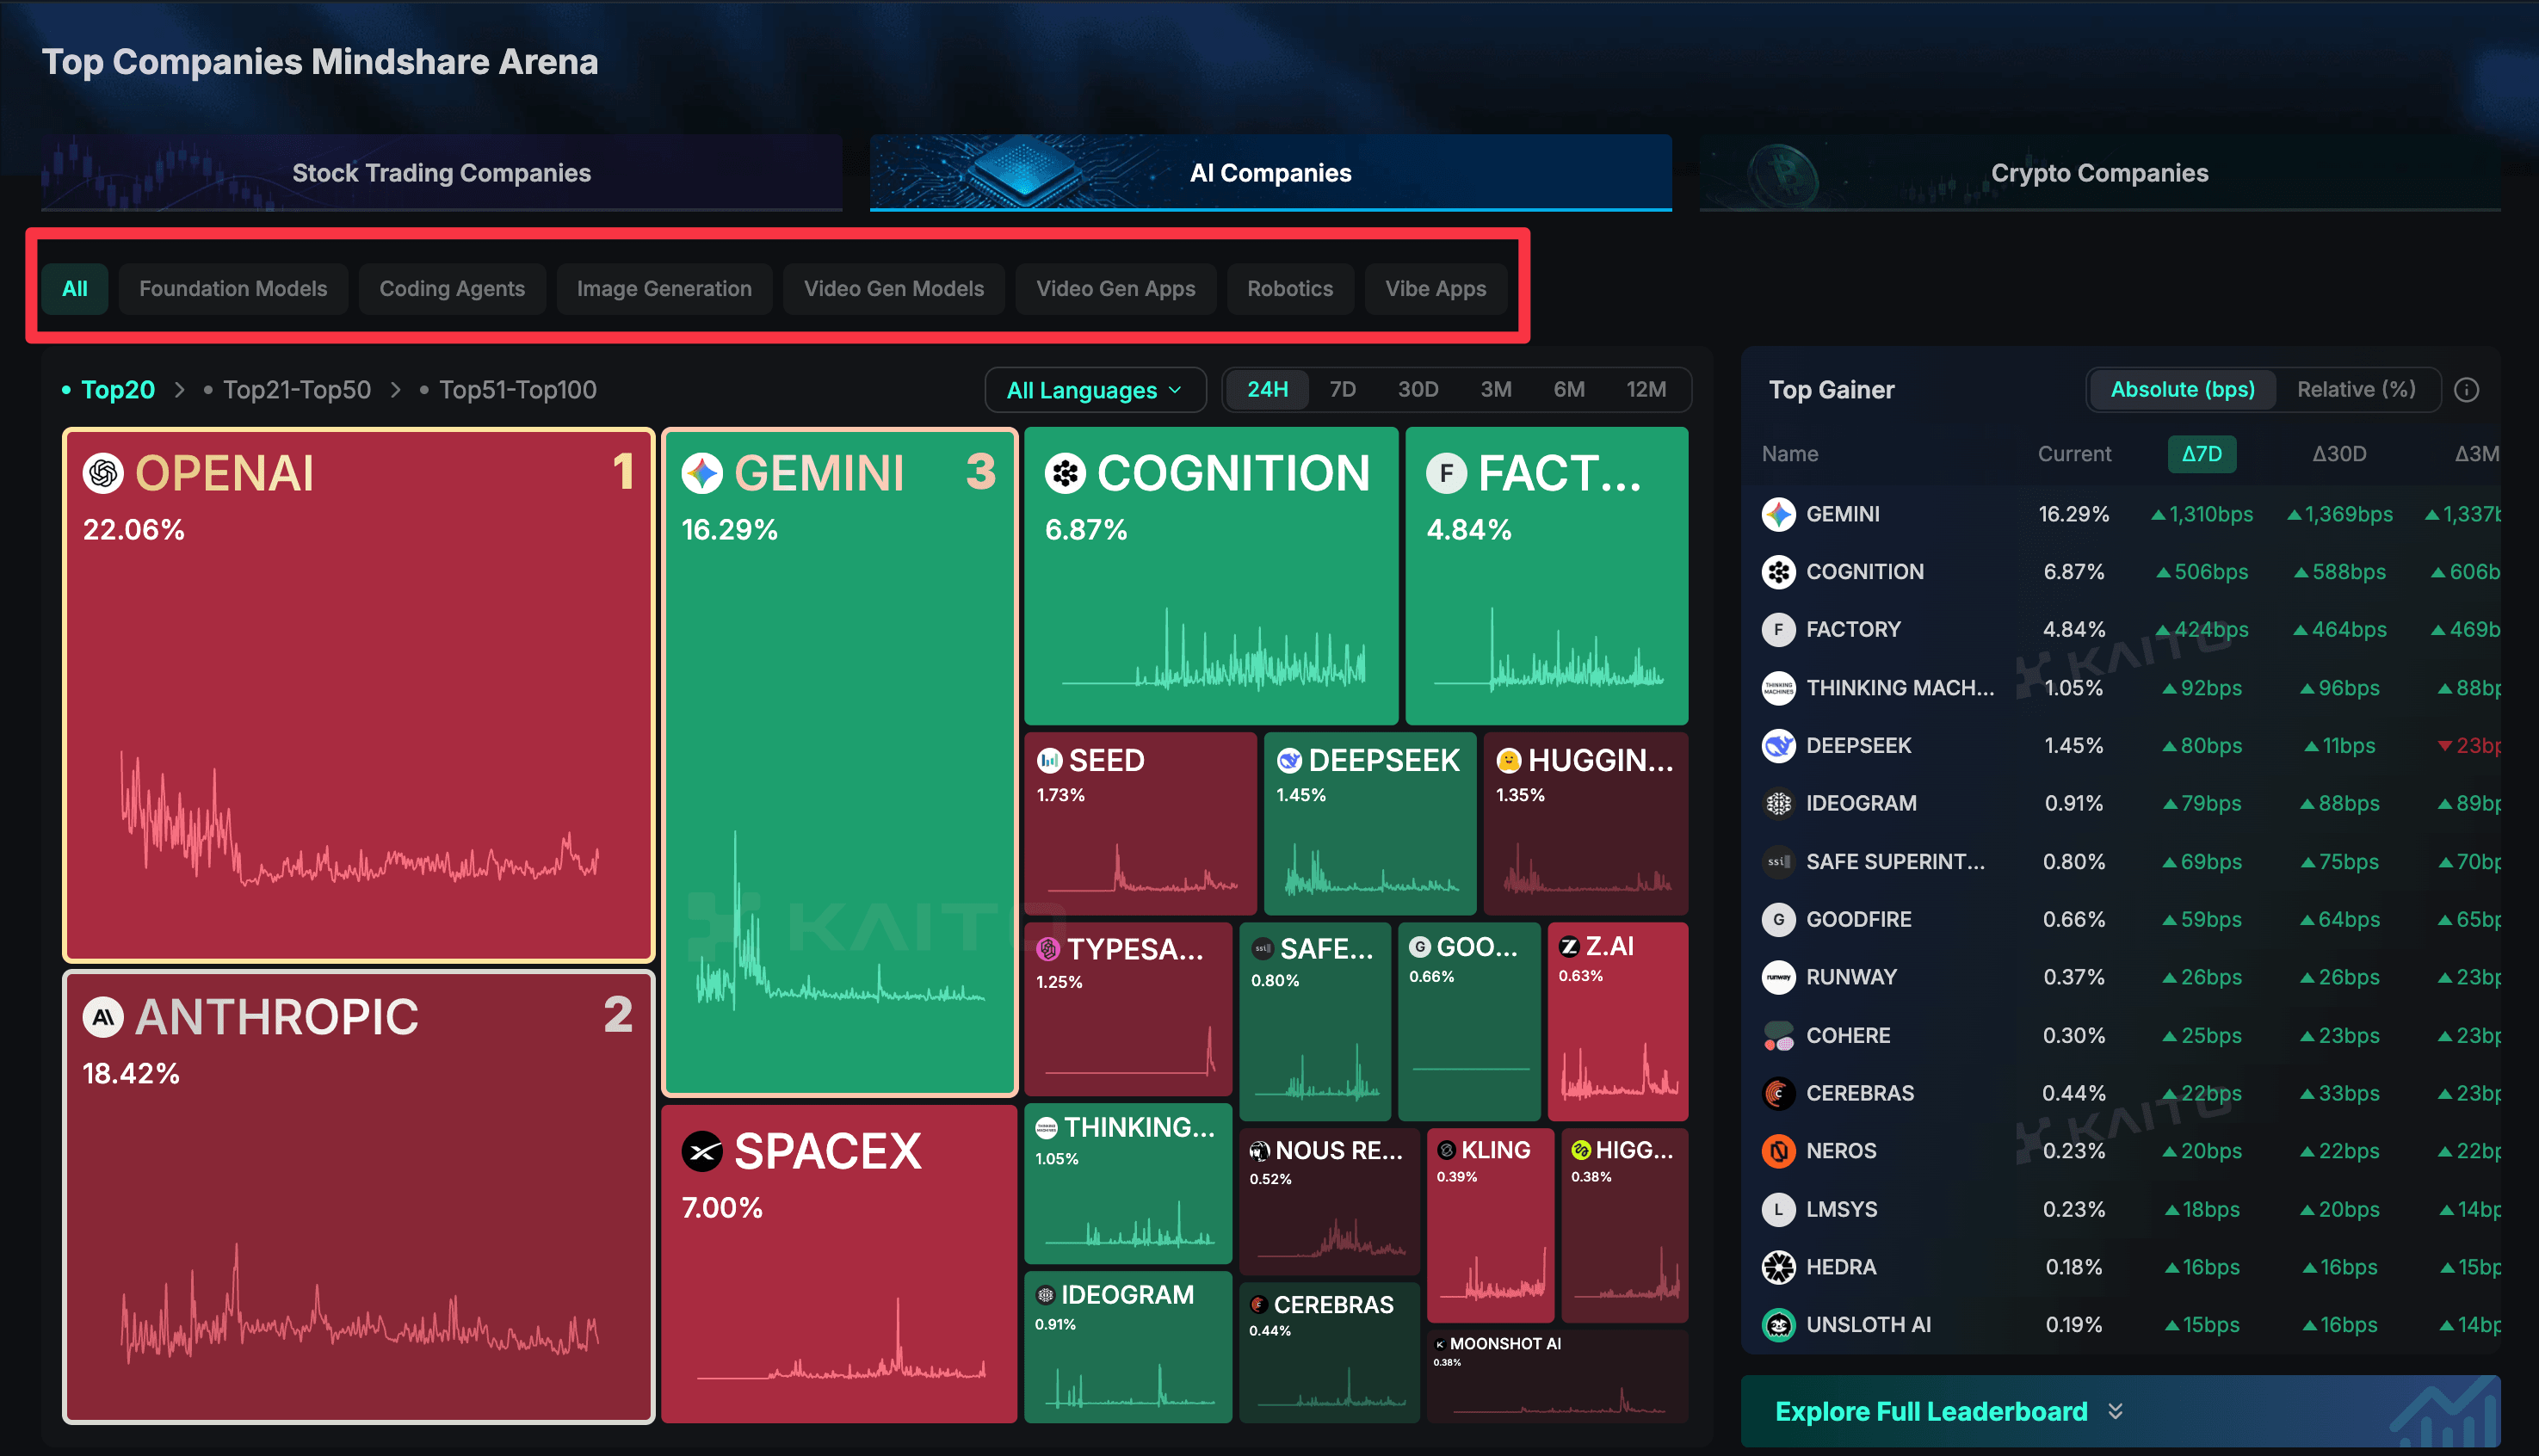
That distinction helps you choose relevant peers: research into a video model addresses a different question from research into an application built around video generation.
Read the entity name as well as the category. A company, a model family and a consumer application can be related without being interchangeable. Attention around an AI company also does not establish how well a specific model performs; capability claims need separate benchmark evidence.
Top Voices has Stock Trading Voices, AI Voices and Crypto Voices. Use these views to explore accounts in the conversation you want to understand. For example, someone researching an AI release can start with AI Voices to find commentators worth reading, then assess their posts directly. A voice’s position is a starting point for discovery, not a guarantee that its claims are accurate.
How do you turn a leaderboard change into useful research?
1. Define the question before choosing the view.
For a listed company’s earnings announcement, start with Stock Trading Companies and Post-IPO. For a private company, use Pre-IPO. For an AI release, choose the relevant AI category and check exactly which entity is being ranked. Crypto Companies provides a starting point for exploring crypto entities. Use Top Voices when your question concerns the accounts discussing a market.
A useful question is specific: “Did attention around this company remain elevated after its product launch?” That gives you a subject and an event to investigate, rather than a leaderboard position to interpret in isolation.
2. Record what the percentage represents.
Note the view, selected category and time window. Record any language or region setting, the observation date and the metric’s stated comparison group. Keep these settings consistent when comparing readings.
Check the scope of each panel separately. A page can show several charts with their own time controls. Also check whether a filter changes the comparison group used to calculate percentages or simply narrows the rows displayed. Selecting a category does not, by itself, prove that every percentage has been recalculated within that category.
This is also where percentage points matter. A move from 2% to 3% is a gain of 1 percentage point, or 100 basis points. It is a 50% increase relative to the starting value. Those describe the same change in different ways.
3. Read the discussion around the change.
Find the announcement or development that coincided with the move, then read how people responded. For stocks, that might mean an earnings release and the discussion of its guidance. For an AI model, it could mean the release notes followed by independent testing. For crypto, it could be a network upgrade or a governance proposal.
Follow up through the research views available for that subject. Kaito Pro can support deeper investigation where its search and analytics cover the topic; primary announcements and original posts provide additional context. Check the coverage of the specific module instead of assuming that every market has identical tools or history.
Look beyond the most repeated explanation. A widely shared claim may trace back to one source. Reading independent responses helps you distinguish a broad discussion from several accounts repeating the same point.
4. Separate attention from reaction.
More attention can accompany enthusiastic adoption or a serious problem. Read sentiment alongside the underlying posts where sentiment data is available. Check what people are reacting to and whether the discussion comes from the audience relevant to your question.
For example, a model release could attract substantial attention because users report a capability improvement, because they dispute a benchmark, or because access is failing. The mindshare movement alone cannot tell you which explanation fits.
5. Check whether attention persists.
Compare equivalent windows before and after the event, keeping the event day separate where possible. Review daily readings as well as period averages: one unusually large day can lift an entire week’s average.
State how you calculated the result. An average of daily mindshare percentages is not necessarily the same as the subject’s share of all attention across the whole period. Use the same calculation for the baseline and follow-up.
The result should be an observation you can support: which subject gained attention, within which comparison group, and for how long. Link that observation to dated source material, and distinguish a plausible explanation from a cause you have established.
What should you look for in a mindshare analytics tool?
Choose a tool that makes its numbers interpretable and gives you a way to investigate changes.
- Can you measure attention in stocks, crypto or AI?
- Can you quantify influence instead of guessing from follower counts?
- How do you compare a company’s attention with its competitors over the same period?
A good mindshare tool answers these questions with numbers you can check. It measures attention and influence across stocks, crypto and AI in a quantifiable way, shows which comparison group each score belongs to, and lets you trace any movement back to the underlying discussion.
| Check | What you need to know |
|---|---|
| Comparison group | Which companies, assets or accounts are included? |
| Metric coverage | Which sources contribute to this particular score? |
| Quality controls | How are irrelevant content, repetition and suspicious activity handled? |
| Methodology | What is explained publicly, and which parts remain proprietary? |
| History | Can you compare equivalent periods and see whether the method changed? |
| Research context | Can you investigate the posts, events and sentiment around a change? |
If you plan to use the data in a recurring report, also confirm export access, historical availability and the refresh rate for the specific metric you need.
When researching a token, following an AI company or comparing your project with competitors, mindshare will give you a way to put online attention into context. You can see which subjects are gaining ground, then look at who’s discussing them and what’s driving the interest.
Start with a few relevant peers, compare the same time periods and read some of the conversations behind the numbers. Over time, that makes it easier to judge whether a project is building sustained interest or experiencing a brief spike around an announcement.
How can you track mindshare with AI?
You can track mindshare with AI by connecting Kaito MCP to a compatible AI assistant.
When you can ask follow-up questions, mindshare is even more valuable.
- Who received peer attention?
- Has interest continued since the launch date?
- What were people really talking about?
When Kaito MCP is connected to your AI assistant, you can utilize Kaito data to examine these questions within the same conversation. Start with a project, a timeframe and a clear comparison group. These details help your assistant distinguish a project gaining attention among its peers from a broader increase in sector interest.
Once Kaito MCP is connected, try a prompt like this:
“Using Kaito, return NVIDIA daily mindshare in tracked equity conversation, mentions per day and average sentiment from 2 Sep to 1 Oct 2026. Give weekly averages, and include the retrieval date.”
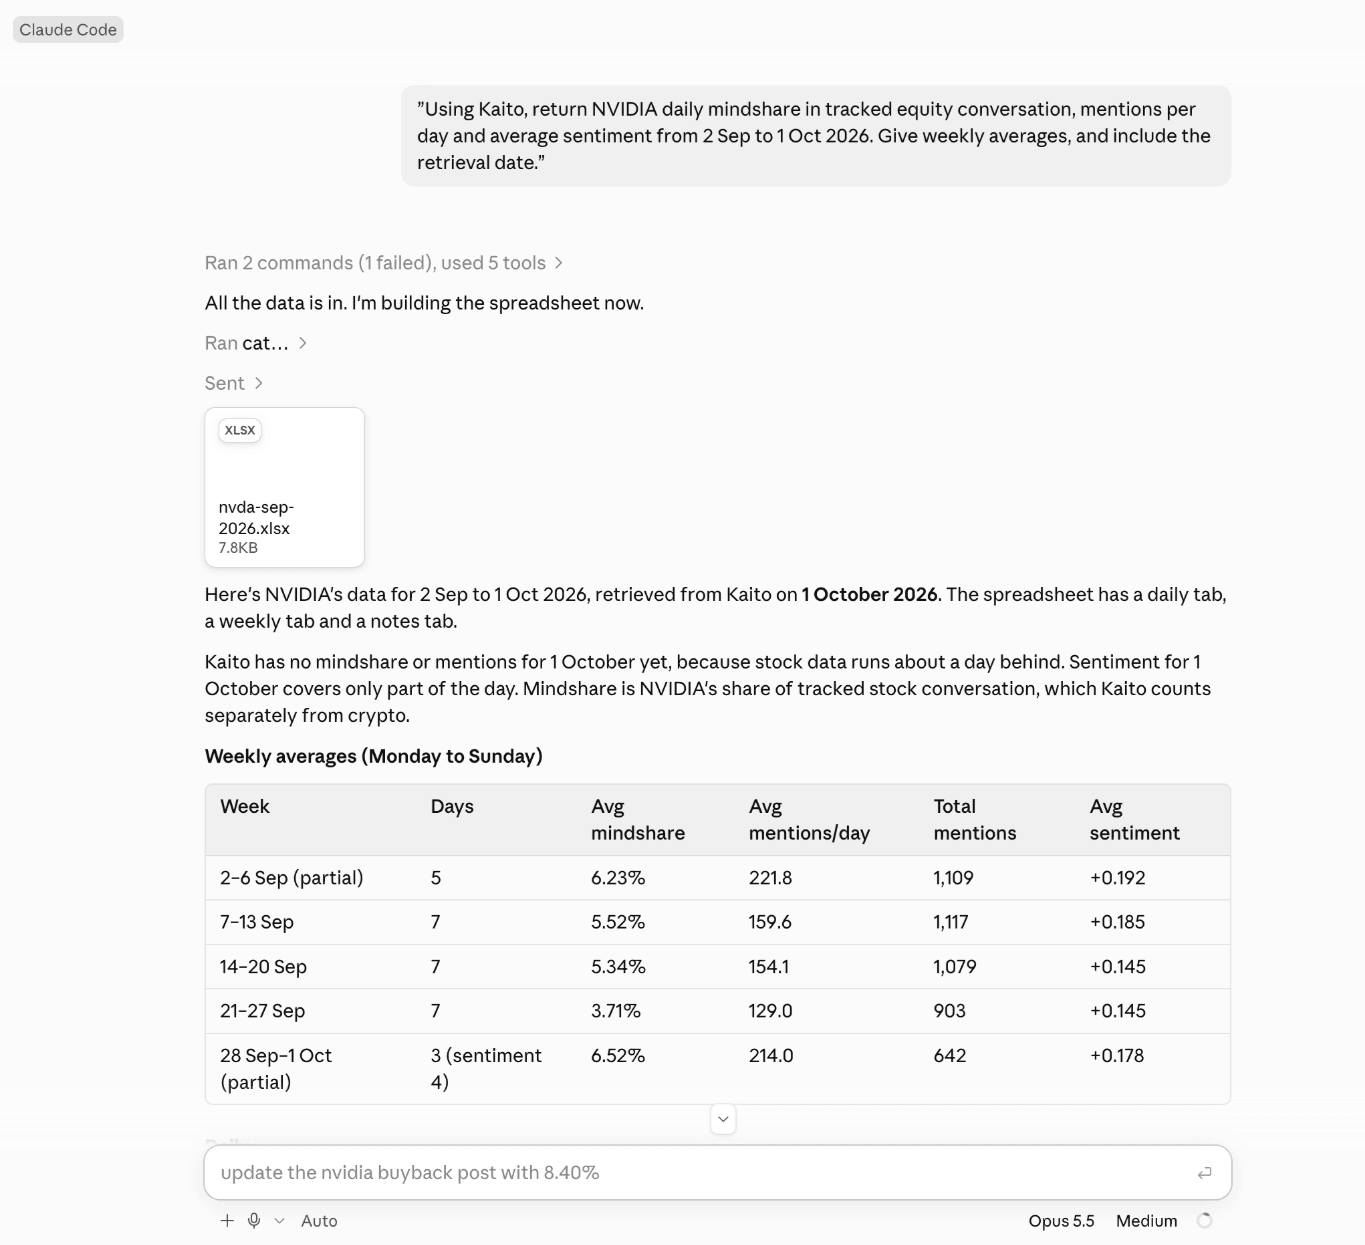
From there, you can ask follow-up questions in the same conversation: what drove a change, whether attention held after an event, or how peer companies moved over the same period.
FAQs
What does 5% mindshare mean?
A 5% mindshare reading means the subject received 5% of the attention measured within that metric’s comparison group and period. It does not mean 5% of all internet users know about the subject or support it.
Is mindshare the same as share of voice?
No, even though the terms can overlap. Share of voice measures a brand’s share of a defined visibility metric, which may use mentions, impressions or other inputs. Mindshare measures attention using the provider’s chosen methodology.
Does higher mindshare mean positive sentiment?
No. Mindshare measures the amount or share of attention; sentiment measures its tone. A security incident or unpopular announcement can increase discussion while making sentiment more negative.
Does rising mindshare mean a token or stock will rise in price?
Rising mindshare alone does not establish a future price move. It can reflect a new development, a reaction to price movement or coordinated promotion, so you need to investigate the cause before drawing a conclusion.
What is the difference between percentage points and percentage growth?
A rise from 2% to 3% mindshare is a gain of 1 percentage point, or 100 basis points. Relative to the starting value, it is a 50% increase.
Where can I track mindshare?
Explore companies and voices through the Mindshare Arena on kaito.ai. For crypto, stock and AI research, Kaito Pro combines token and narrative mindshare with search, sentiment analytics, alerts and other research tools.