
What Is a Social Graph? Measuring Influence Beyond Followers
Learn what a social graph is, how it differs from follower count, and how Kaito Smart Followers add context to influence across crypto, AI and stocks.
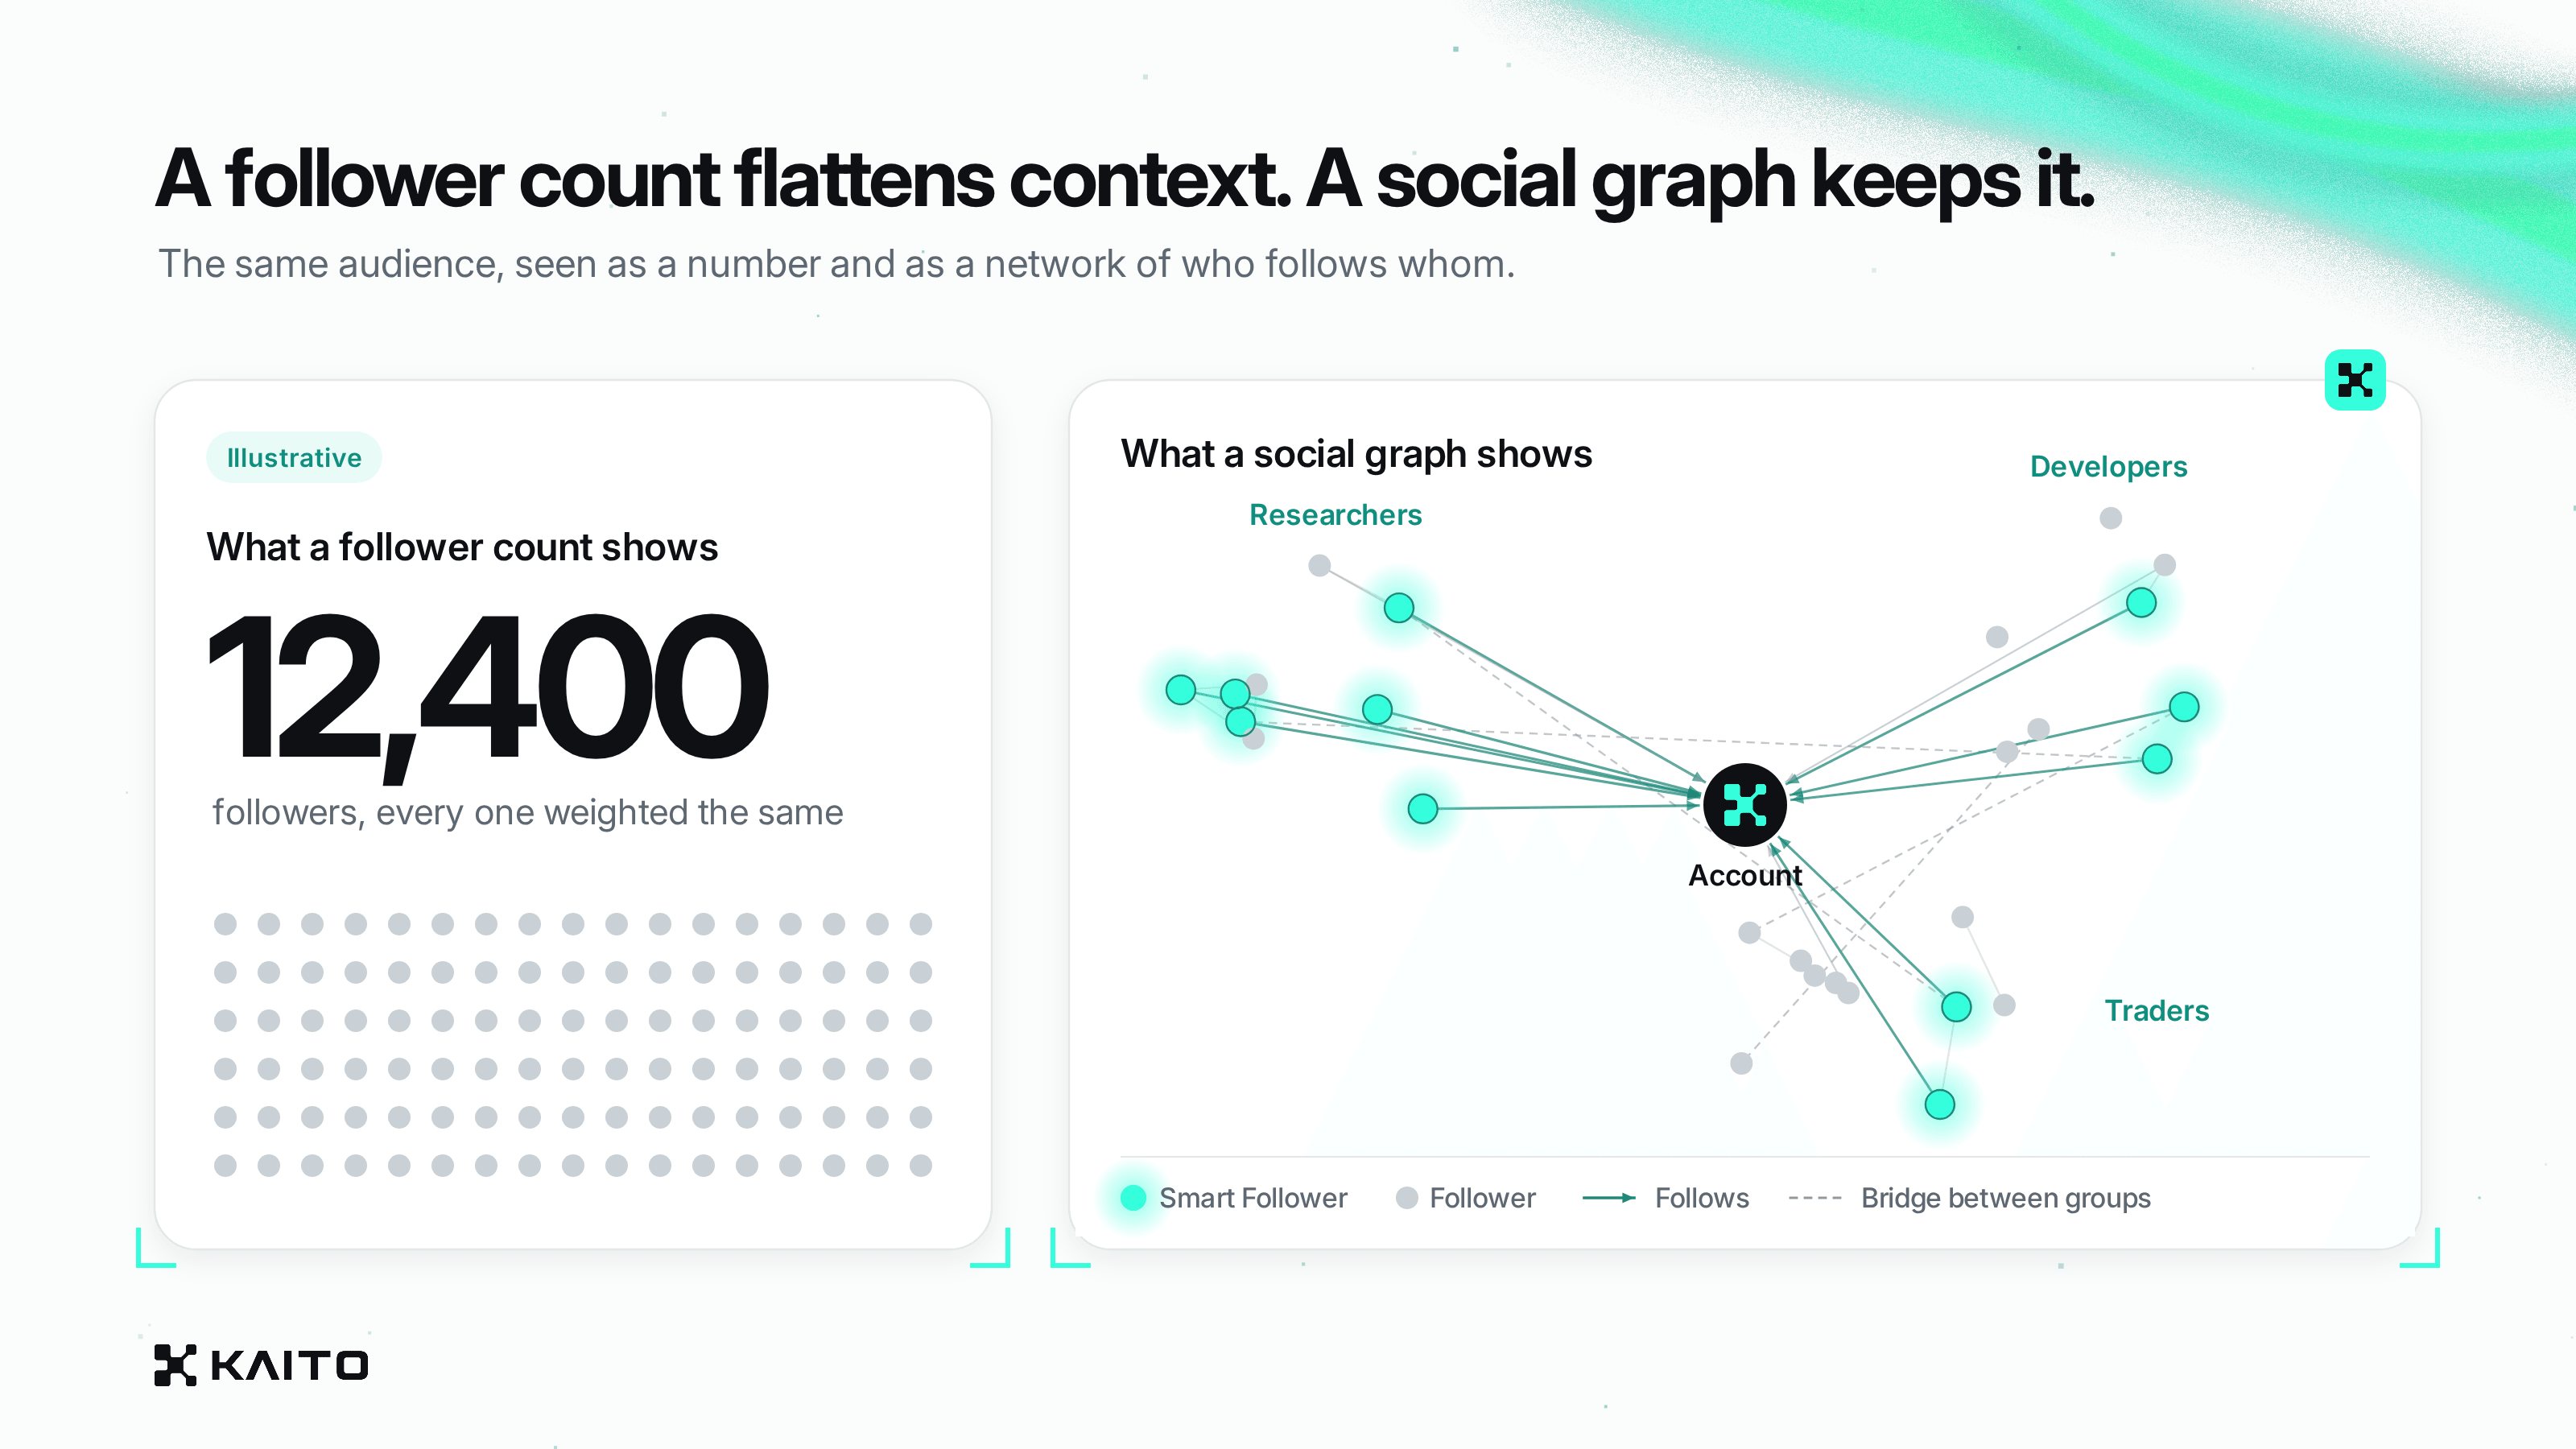
A social graph is a map of relationships of different participants, also known as nodes. This relationship is commonly called an edge. This is a much richer way to look at influence than follower count, since the data points don’t lose context.
By mapping the entire graph it is possible to see who follows whom, rather than the simple number of followers a given account has. It is also possible to look at the direction, strength, and time of these relationships.
Let’s dive deep into how can you use a social graph to give you an edge in research and marketing.
How does a social graph work?
A social graph maps out the relationship between different participants, also known as nodes, in a network. This relationship is commonly called an edge. There are a couple of different ways that edges can be formed between users: follows, friends, interactions etc.
The type of information a social graph captures is determined by the data it uses. Consider a developer followed by a researcher who communicates regularly with a founder. A social graph captures these relationships and the way they connect to the rest of the community.
In addition to capturing these relationships, a social graph provides three important ways to categorize connections:
| Attribute | What it represents | Example |
|---|---|---|
| Directed/undirected | Whether a connection has a directionality or is reciprocal | A follow has a directionality. A friendship is reciprocal. |
| Weighted/unweighted | Whether connections have differing values | Repeated communications may be given greater value than a single communication. |
| Snapshot/temporal | Whether relationships are captured at one point in time or tracked over time | A temporal graph allows you to observe changes in an account's connections. |
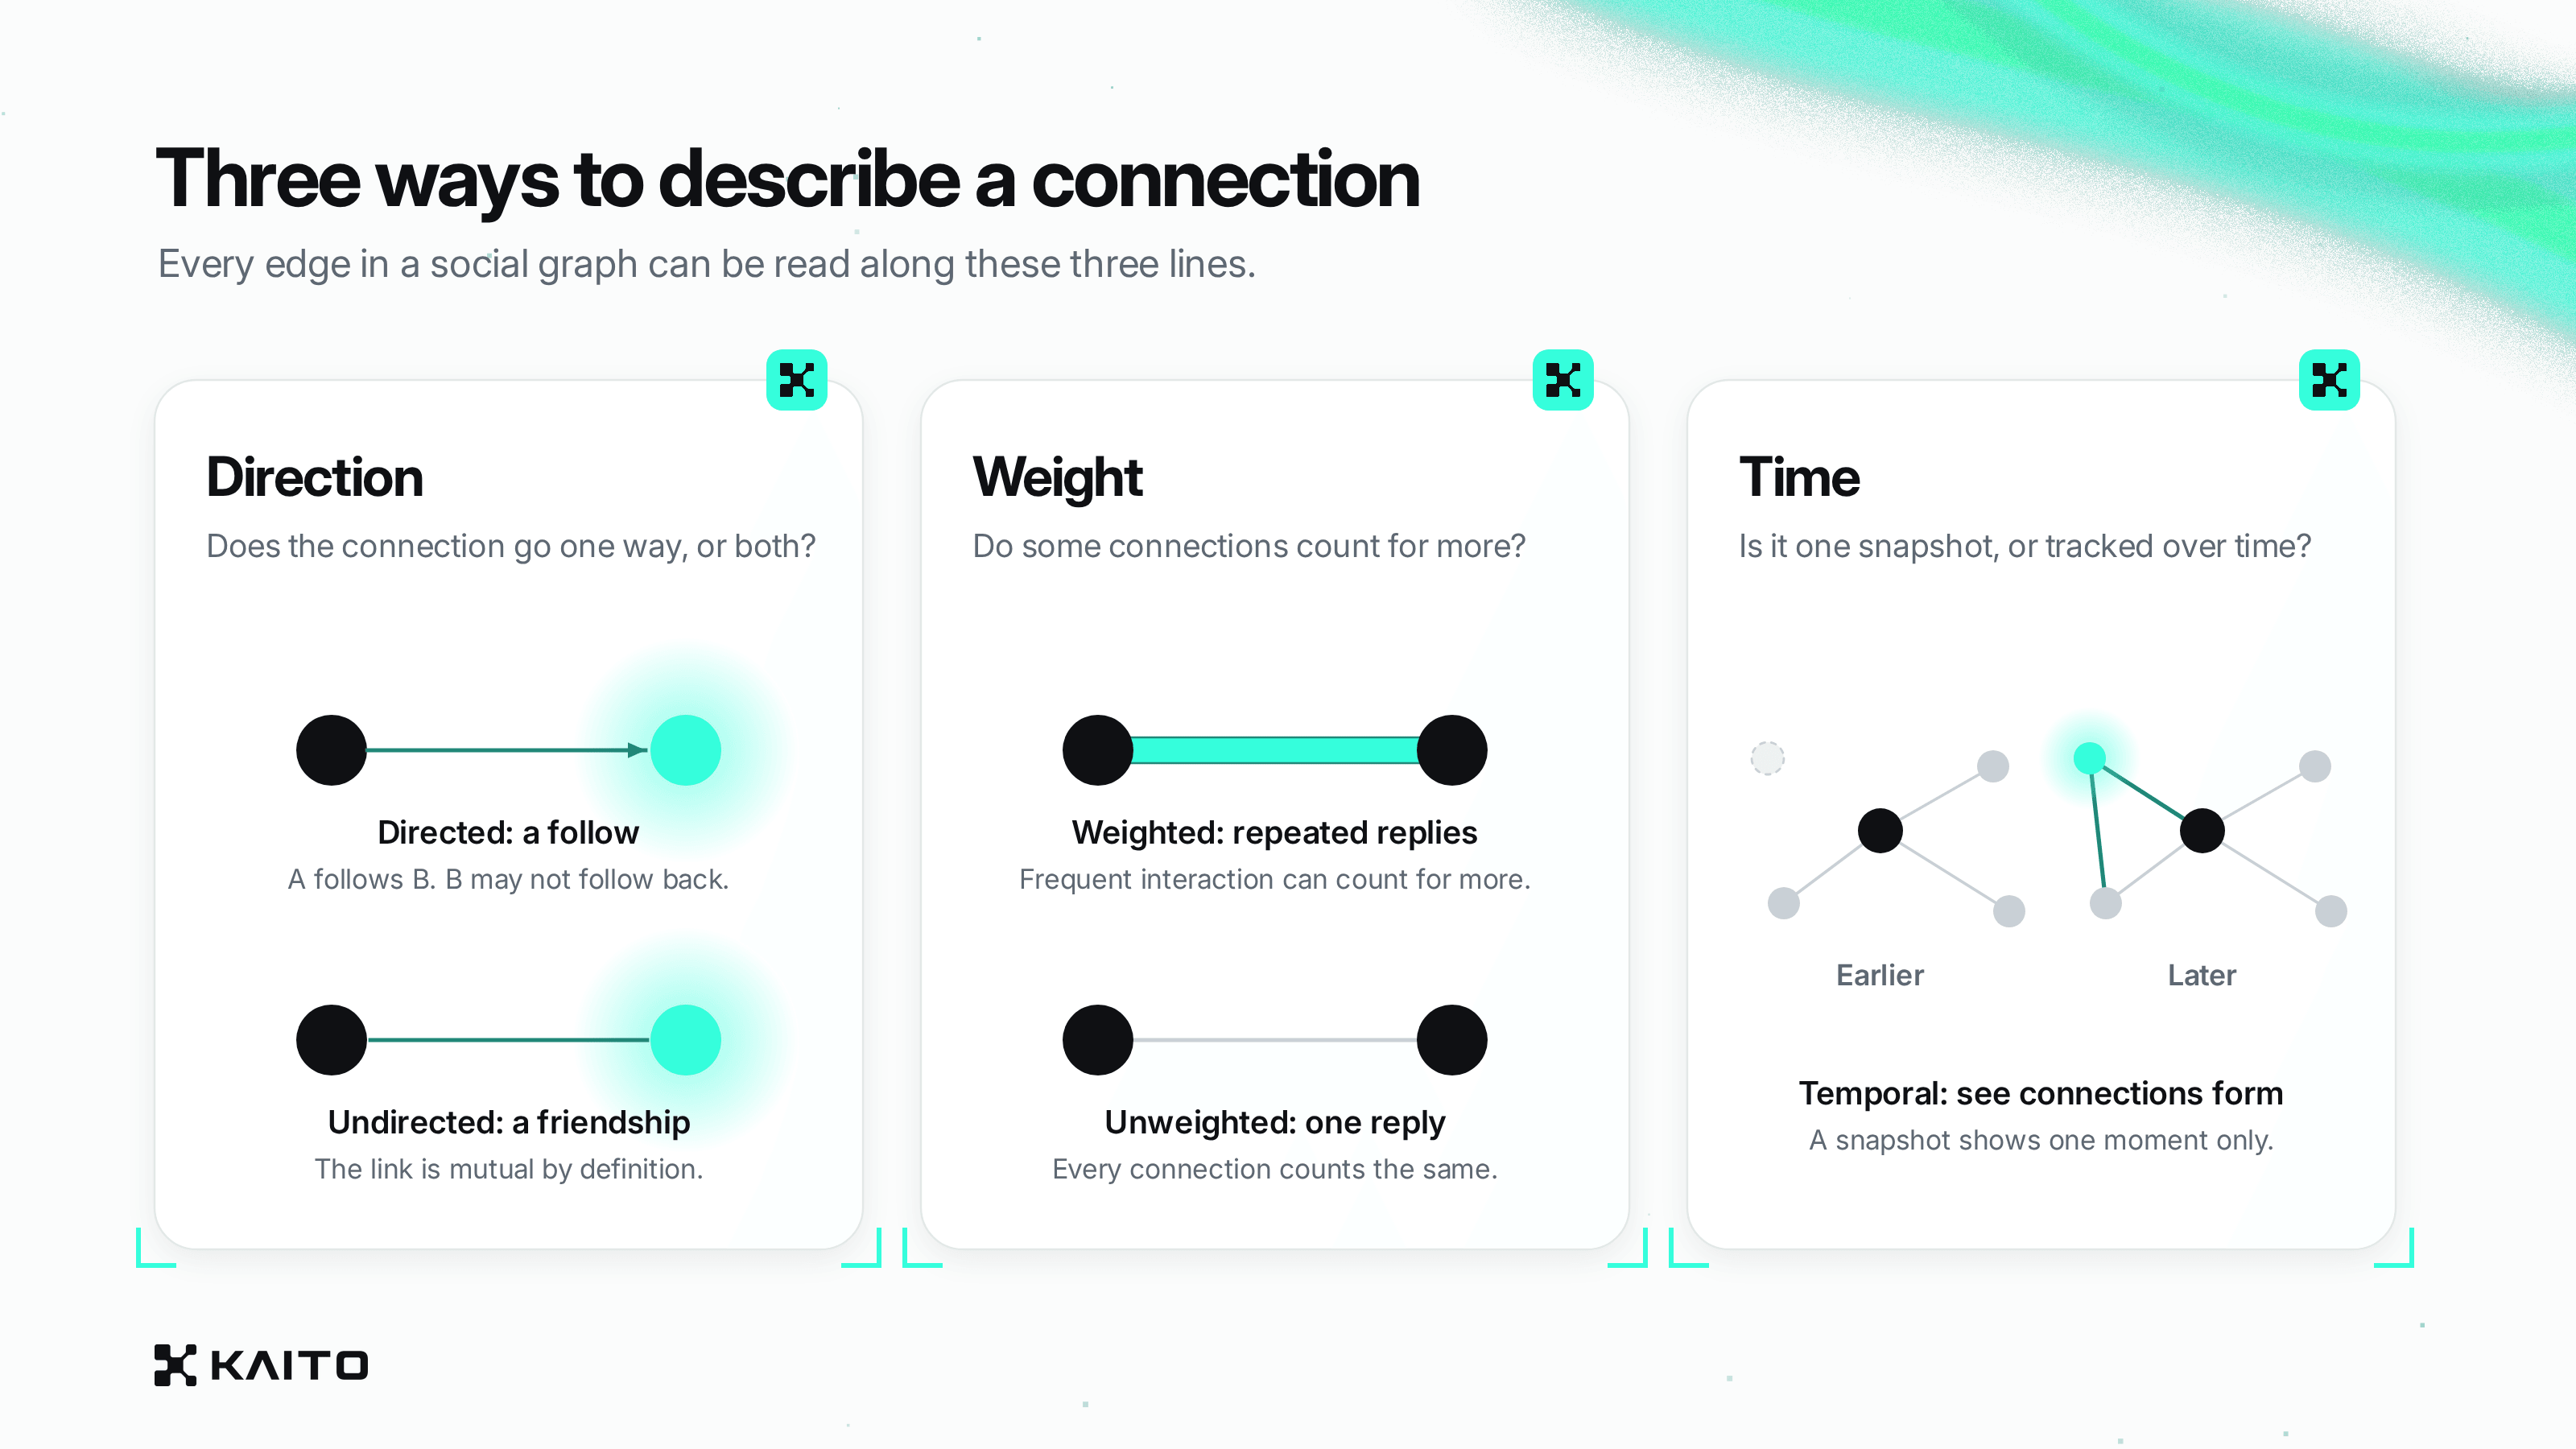
Although a follow requires interpretation, people follow accounts for reasons other than to simply agree with them. Examples of reasons people follow accounts include learning about a topic, disagreeing with a position, monitoring competitors, or staying current with an industry. A follow does not indicate which reason applies to a specific account.
How is a social graph different from a knowledge, interest, or identity graph?
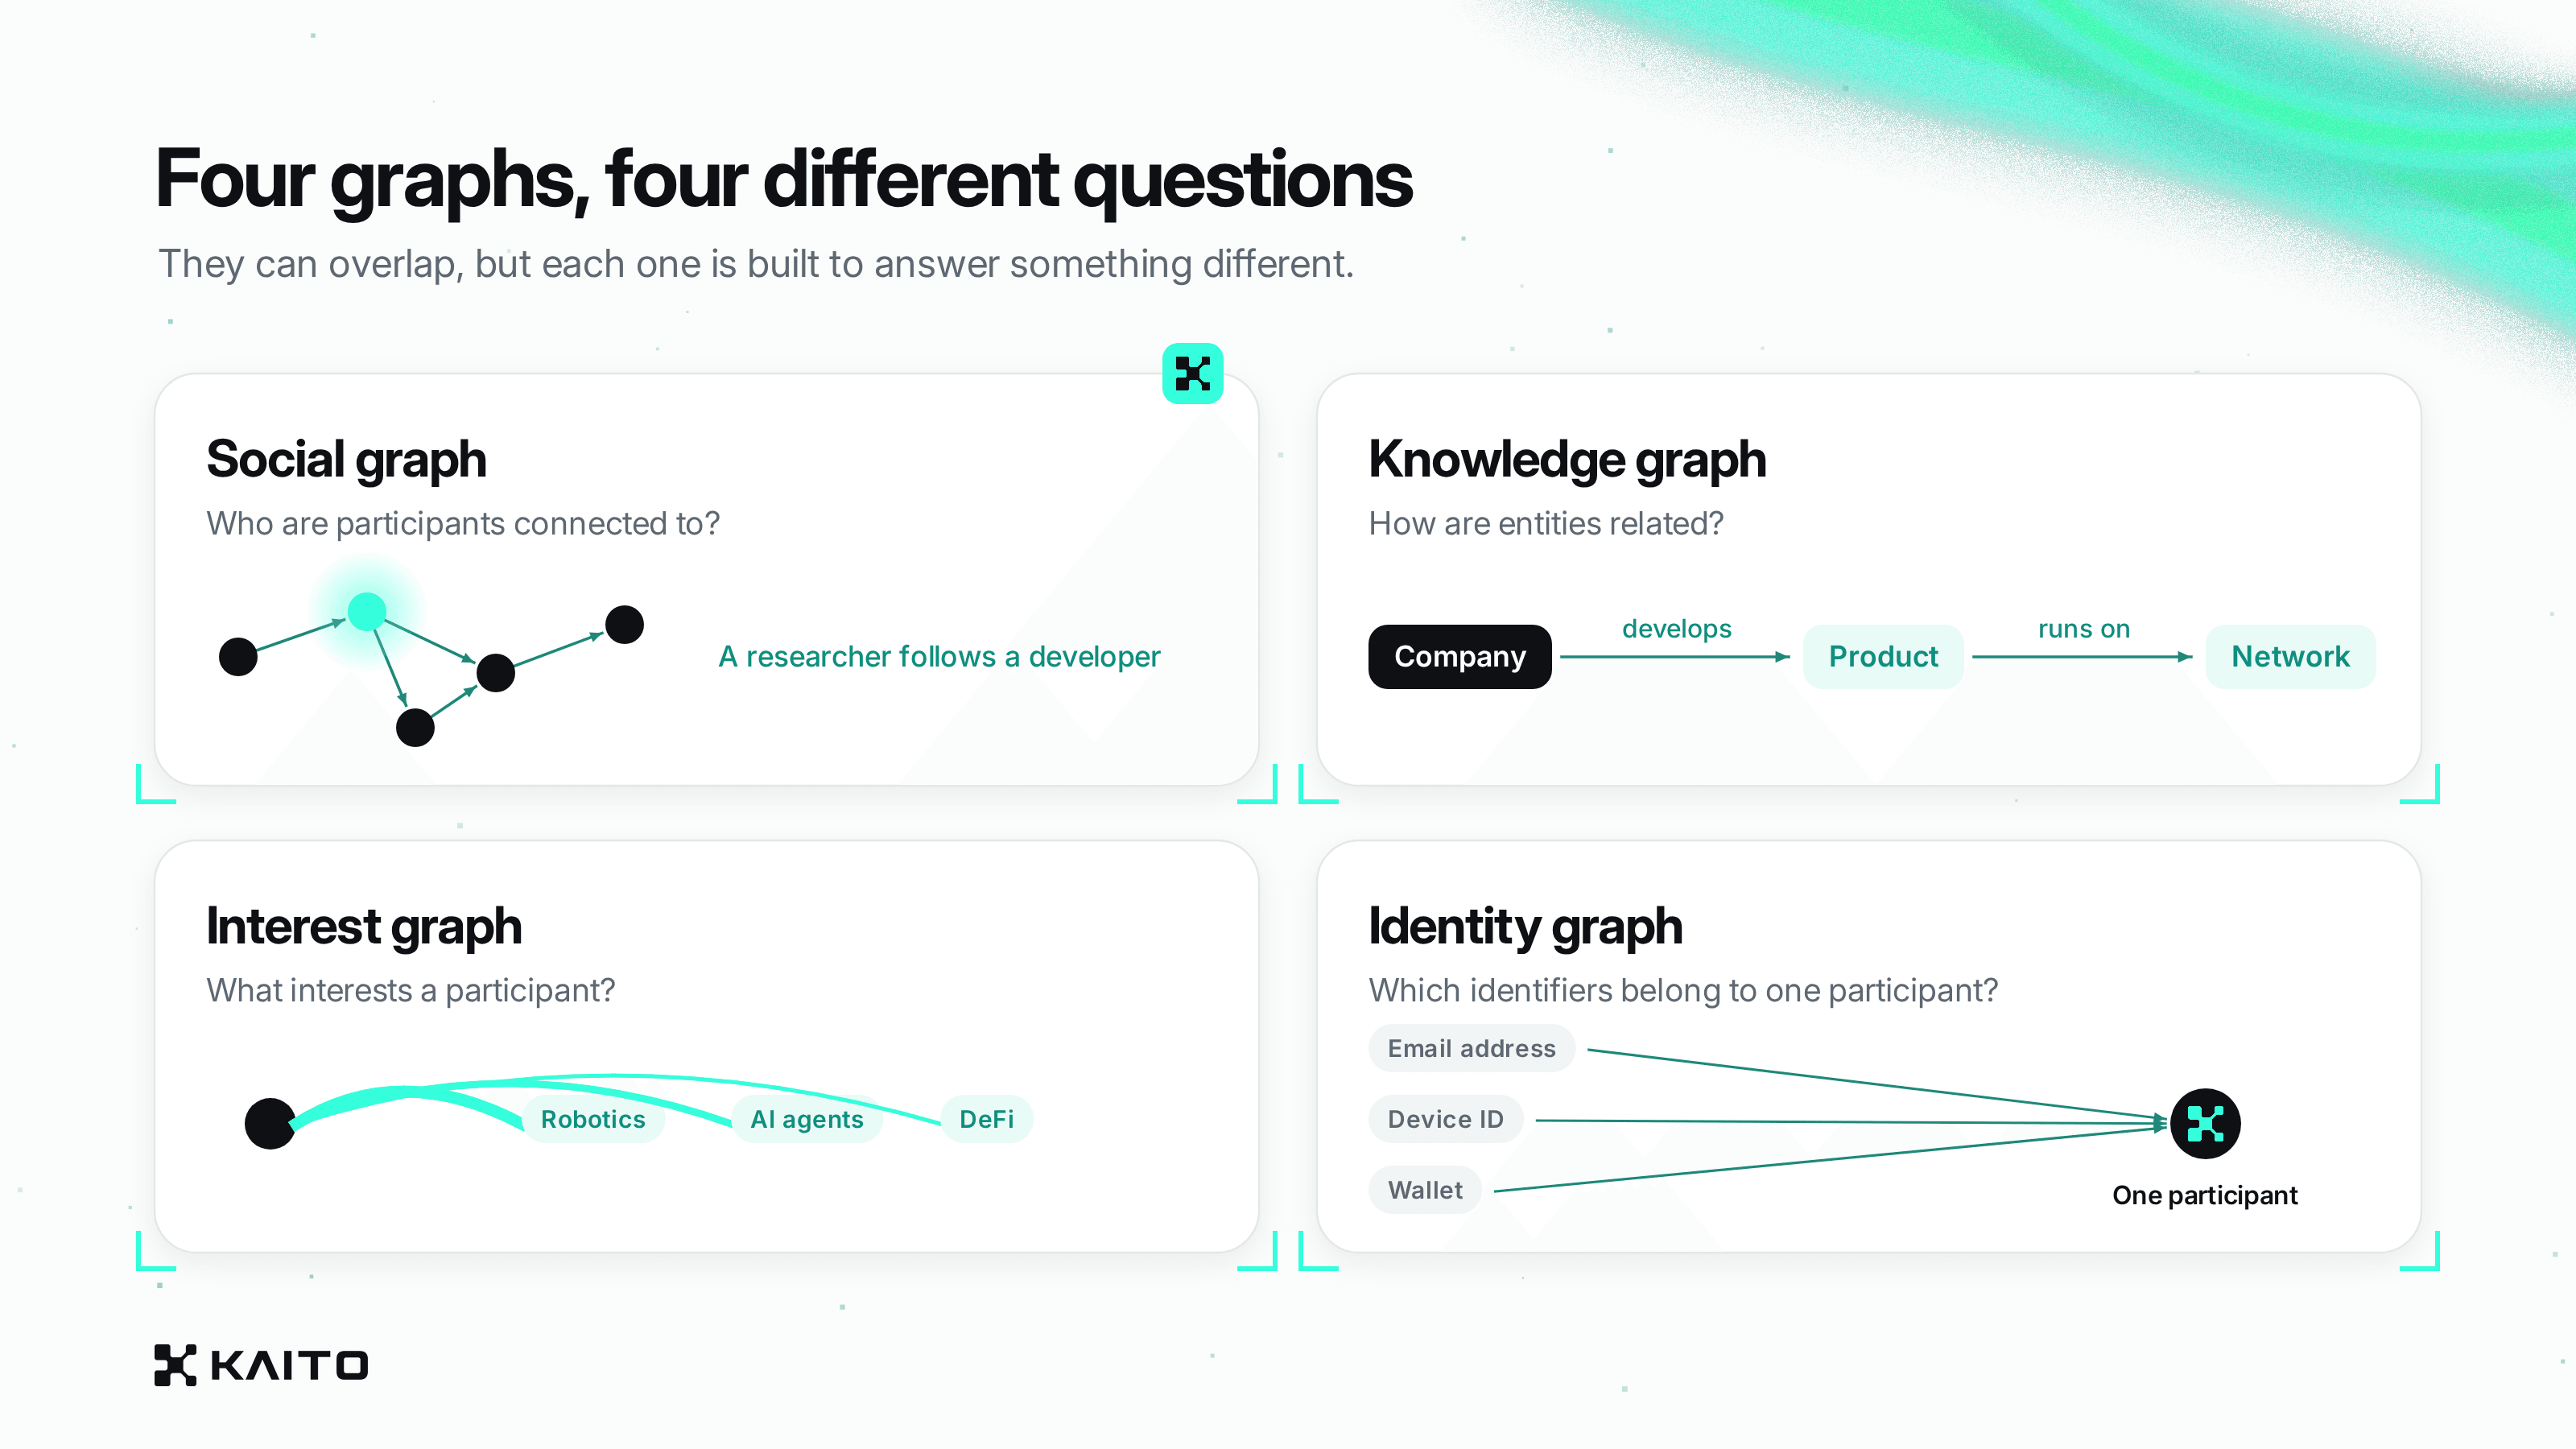
A social graph shows relationships among participants. A knowledge graph shows relationships among entities using defined relationships. An interest graph shows affinities among people and topics. An identity graph shows identifiers (e.g., email address, device id) related to a single person or organization.
While these types of graphs can overlap, each is designed to answer different questions.
| Graph type | Primary question | Example |
|---|---|---|
| Social graph | Who are participants connected to? | A researcher follows a developer |
| Knowledge graph | How are entities related? | A company develops a particular product |
| Interest graph | What interests a participant? | An account repeatedly interacts with robotics content |
| Identity graph | Which identifiers are associated with the same participant? | An email address and device id are associated with a single customer |
Before comparing graph-based metrics, check which accounts and relationships each system measures. Kaito Smart Followers is one example of how follow relationships can add context to audience size.
What are Kaito Smart Followers?
Kaito Smart Followers are accounts identified as well connected within Kaito’s social graphs across crypto, AI and stocks on X. These graphs map who follows whom, helping Kaito identify accounts connected to other influential participants in each community.
Those accounts can include developers, founders, researchers, investors and traders. Their connections within the network provide context about their standing in a particular field.
Your Smart Follower count is the number of these accounts that follow you. It shows how your audience connects to the wider social graph, adding another dimension to your total follower count.
For research or campaign planning, the next step is to examine who those Smart Followers are and how relevant their expertise and interests are to your goals.
Pika and Luma AI, two companies offering AI video creation tools, illustrate how audience size and network connections can tell different stories.
In this snapshot, Luma had approximately 197,500 followers on X, compared with Pika’s 150,600. But their ranking reversed when looking at Kaito Smart Followers: 869 for Pika versus 738 for Luma.
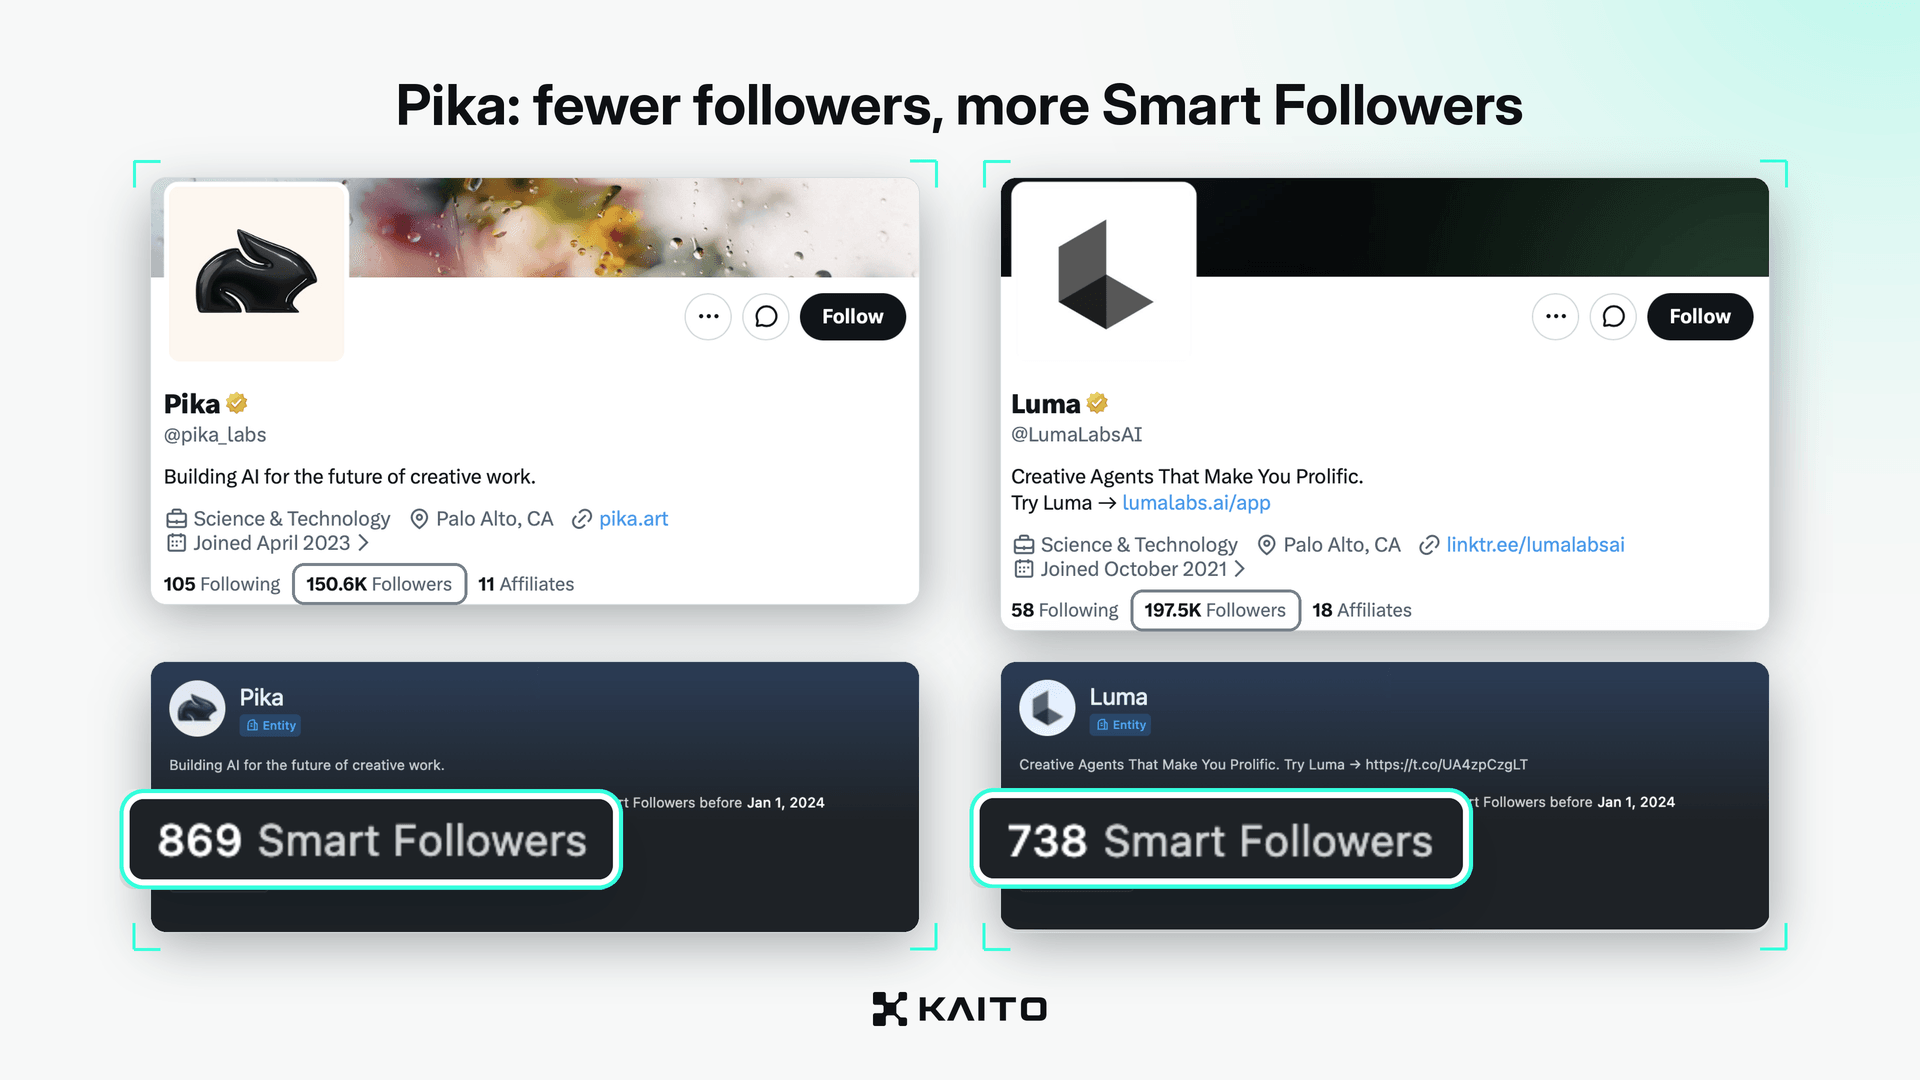
Pika has roughly 24% fewer total followers, yet 18% more Smart Followers.
The comparison shows why audience size alone can miss meaningful differences in who follows an account. It does not tell us which company has a better product or more engaged followers. For research or campaign planning, the next step is to look at who those Smart Followers are and whether they’re relevant to your goals.
Kaito Pulse brings that context directly into X profiles. The browser extension displays Smart Follower counts on profile pictures and lets you explore an account’s top Smart Followers, its breakdown across AI, crypto and equity trading, and its rank in each category.
Use that view as a starting point, then look more closely at:
- Relevance: Do the account's connections participate in the subject matter that you care about?
- Engagement: Are people responding thoughtfully, asking questions, or discussing the creator's work?
- Community reach: Does the account connect with different groups, or does it primarily connect with a single close-knit group?
- Activity over time: Are these relationships active and enduring?
Together, these checks give you a clearer basis for comparison than choosing the largest audience by default.
How does credibility weighting function in a social graph?
Credibility weighting assigns different values to accounts or connections based on signals selected by a system. Examples of signals include recognition from established participants, relevant engagement, or interaction history. The resulting score estimates a participant's standing within a measured network. The significance of the score depends upon the population, input variables, and weighting methods employed.
A follower count that is not weighted treats every follow equally. A weighted system may assign more significance to a connection from an account with established standing within the relevant community.
For example, a system designed for a developer-focused community may assign more significance to engagement from active technical contributors. A system designed for a different type of community may employ different signals and yield different results.
Can a social graph identify fake accounts?
A social graph can assist in identifying suspicious relationship patterns. At the same time, it cannot definitively establish whether every account is authentic. Coordinated accounts may exhibit unusual clustering or repetitive connection patterns.
Additionally, coordinated accounts may develop relationships with legitimate users, which makes distinguishing them through network structure alone challenging.
Context is critical here. A small, tightly-knit group may be coordinating spam, or it may simply be a newly formed community. An account with few connections may be fraudulent, or it may have recently joined.
Relationship patterns become more informative when viewed in conjunction with posting behavior, account history, and other relevant evidence.
Credibility scoring and fake-account detection also serve distinct purposes. Credibility scoring assesses standing within a network. Fake-account detection attempts to identify inauthentic activity. Therefore, a high credibility score should not be regarded as an identity verification.
How does Kaito utilize its social graph?
Kaito maps relevant social graphs across Crypto, AI, and Stocks, rather than treating all X followers as equally meaningful to identify Smart Followers.
Smart Follower counts enhance an account's total follower count by demonstrating connections to this recognized cohort. Smart Follower counts illustrate network standing rather than independently validating expertise or accuracy of claims made by participants.
Kaito also utilizes reputation-weighted engagement in conjunction with crypto relevance and original discussion when assessing content for Yaps. Relationship signals and content signals convey disparate information, therefore it is advantageous to maintain separate terminology.
| Term | Description |
|---|---|
| Social graph | Structure of relationships among accounts |
| Smart Followers | Accounts identified through high inter-following ratios within Twitter's (X) social graph across Crypto, AI, and Stocks |
| Smart Follower count | Number of Smart Followers who follow a particular account |
| Mindshare | A metric that helps measure how much attention is concentrated around a particular brand, company, asset, or topic within a defined period of time. |
How can you apply Smart Followers in your research?
Use Smart Followers to understand who is connecting with an account, how those connections change over time and whether they are relevant to your research. In Kaito Pro, you can explore an account’s Smart Follower history alongside a list of its Smart Followers ordered by date.
Take Mike Dudas (@mdudas), a crypto investor and general partner at 6th Man Ventures (6MV). He regularly discusses crypto markets, emerging projects and venture investing.
His Kaito Pro profile shows 5,079 Smart Followers in the screenshot below. The graph shows how that network developed over time, while the list beneath it lets you examine individual accounts, their bios and their own Smart Follower counts.
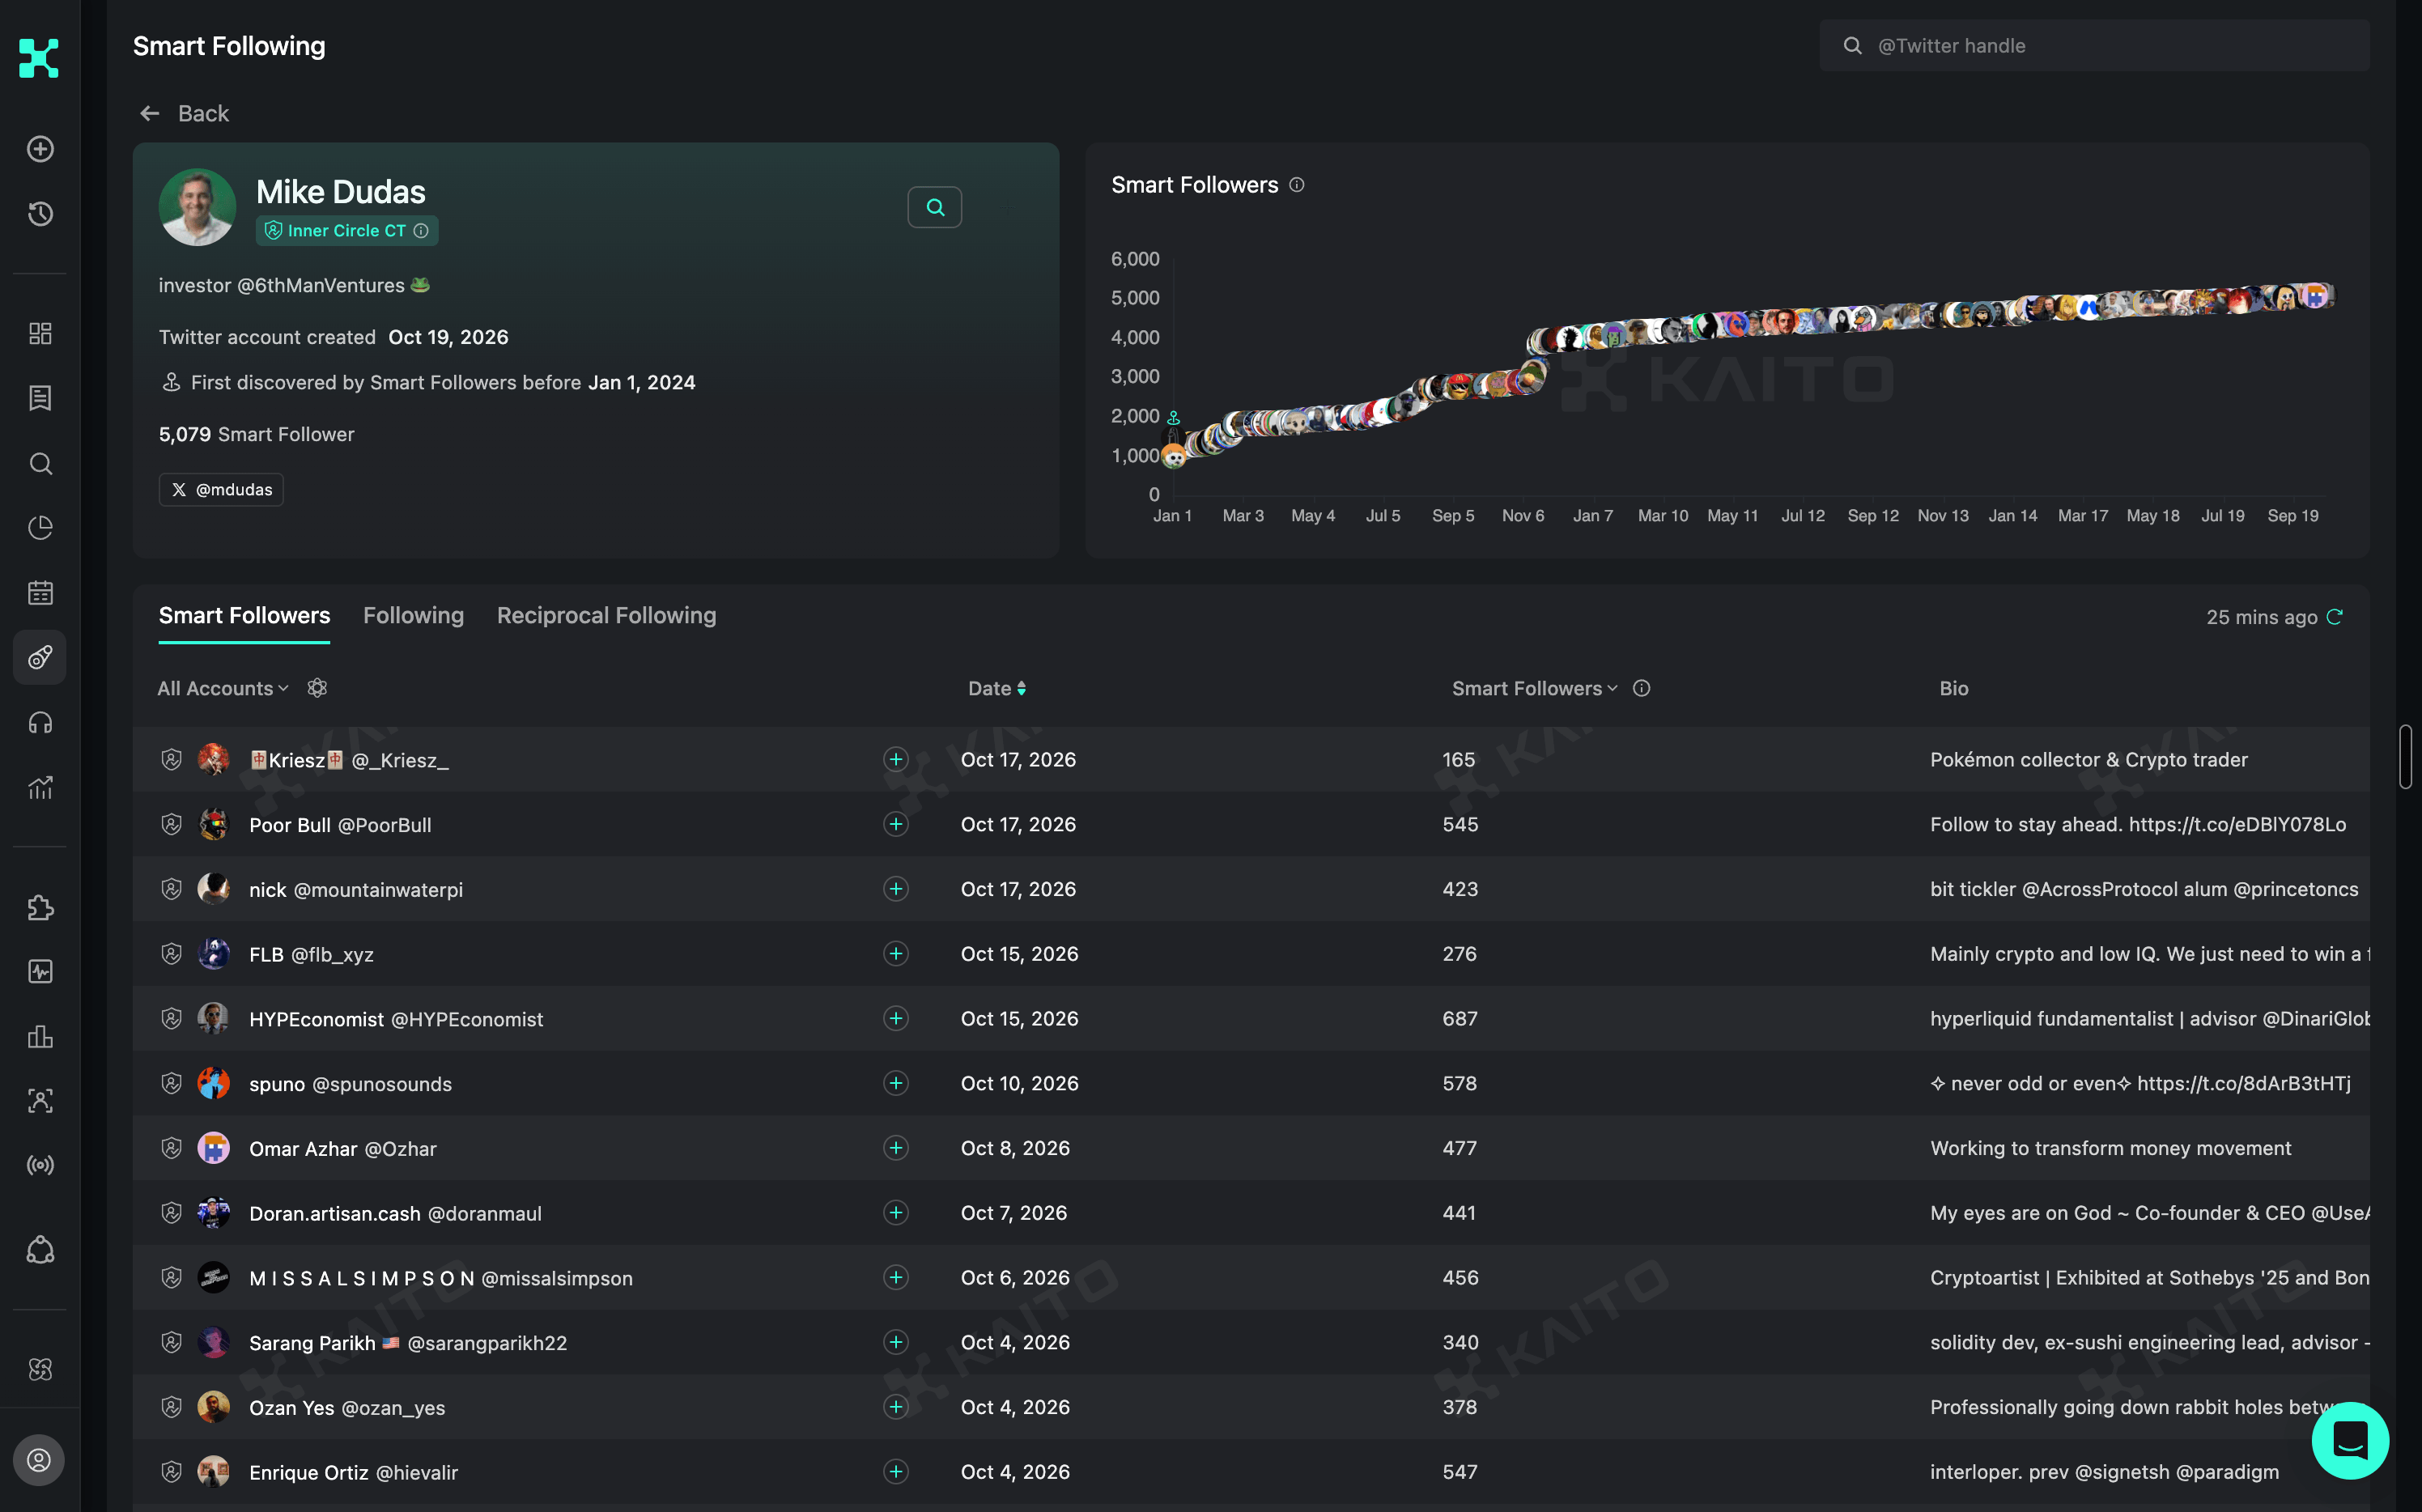
Start with a period of growth on the graph, then review the accounts listed around those dates.
- Are they developers, investors or traders?
- Do several work on related projects or discuss the same topics?
For example, the visible list includes profiles describing work in software development, investing and crypto trading. Those details give you specific people and areas to investigate beyond the headline count.
Next, review Dudas’s posts and discussions from the same period. You can explore whether new connections coincided with a particular topic, announcement or project. That context helps you form a research hypothesis, although it does not establish why someone chose to follow.
The same approach works for a project as well as a person. Take TypeSafe AI, an AI lab that released Jev on September 15, 2026. TypeSafe AI's Kaito Pro profile shows 729 Smart Followers.
Smart Followers first discovered the account on July 20, 2026, but the graph stays almost flat until mid-September. Then it climbs sharply: September 16, the day after Jev's release, adds 222 Smart Followers on its own, and growth continues through the following week before levelling off in October.
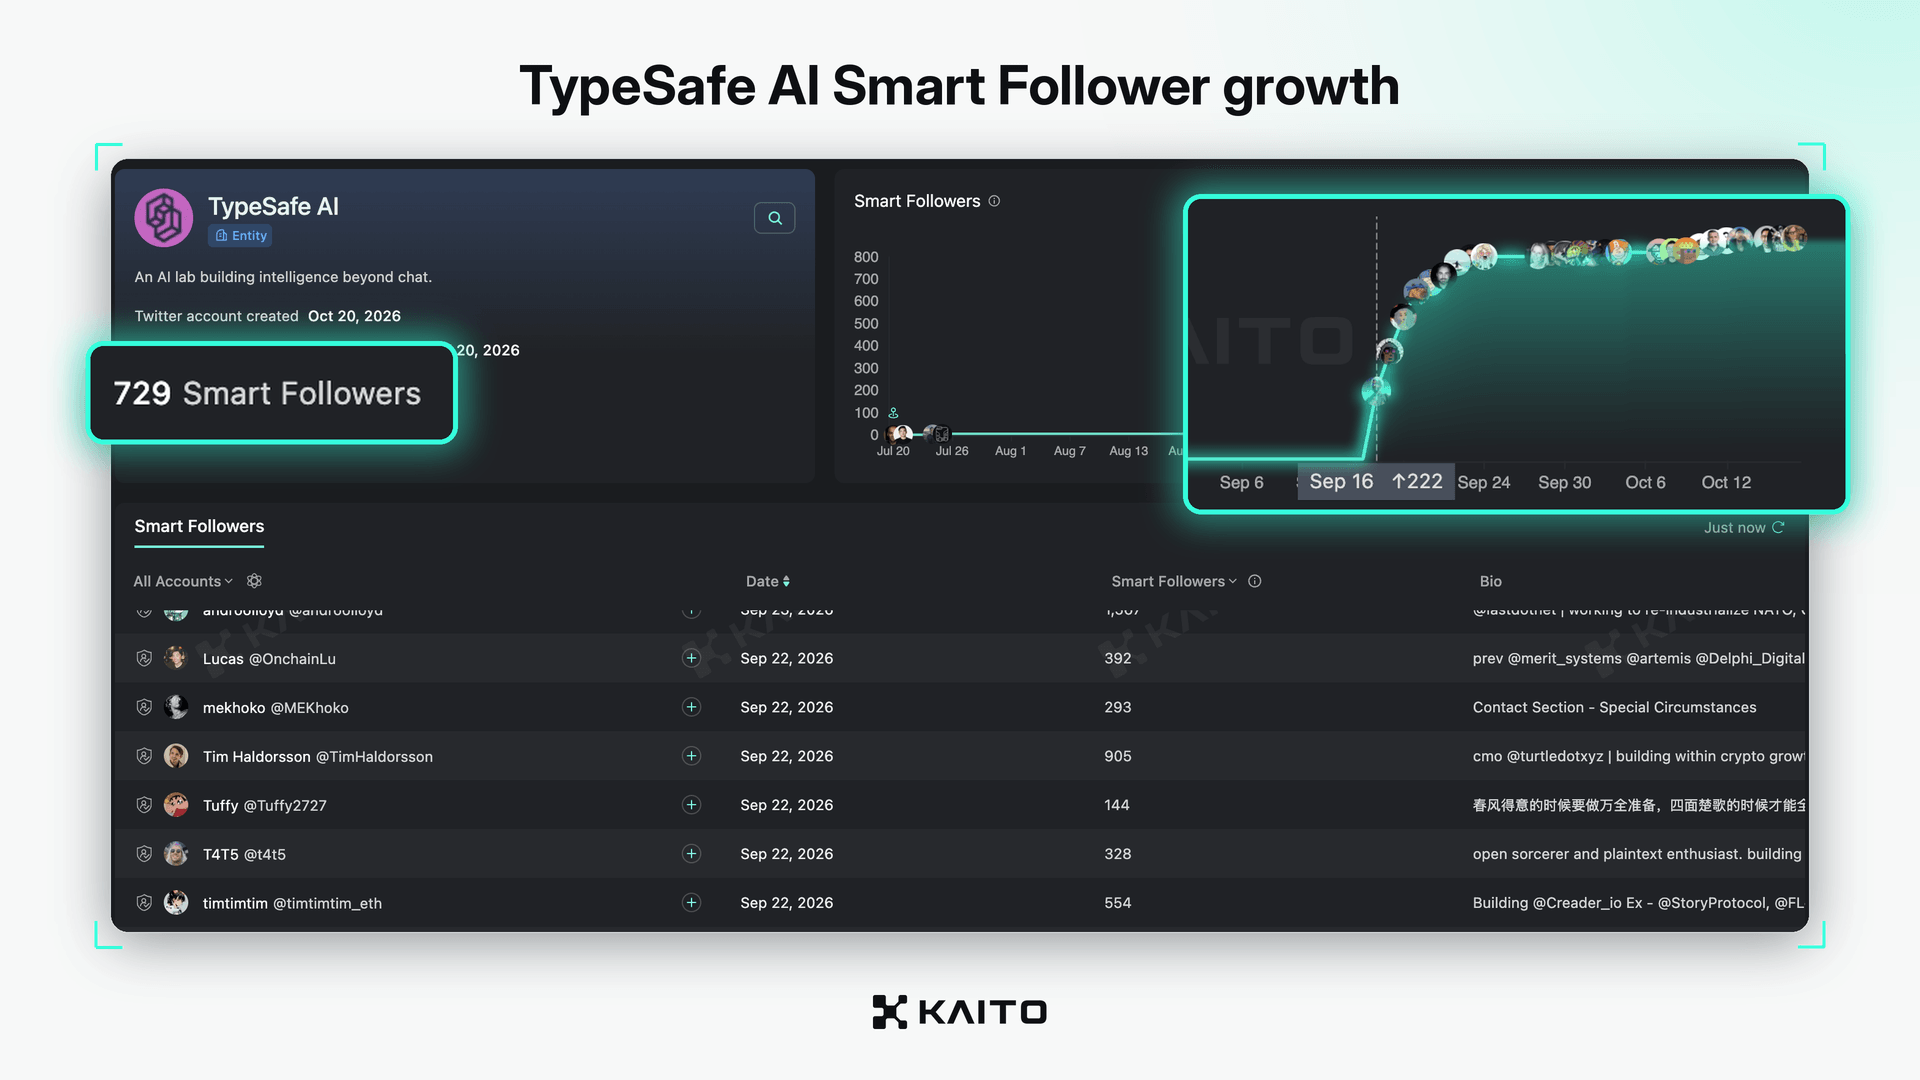
The list beneath the graph shows who arrived during that climb. Sort it by the Date column to follow the progression day by day, from the first accounts to connect through each wave that followed. Among those dated September 22, 2026, you can see:
- Da Hongfei (@dahongfei), founder and chair of Neo, with 441 Smart Followers
- Lucas (@OnchainLu), previously at Merit Systems, Artemis and Delphi Digital, with 392 Smart Followers
- ClaraChengGo (@ClaraChengGo), whose bio mentions working with model-ready data, with 418 Smart Followers
These accounts span crypto founders, marketers, researchers and AI builders. That range is worth noting for a model that is not a crypto product, because it shows the attention extended beyond one community.
Next, compare those dates with TypeSafe AI's posts and the wider discussion around Jev's launch. You can check whether the steepest days line up with the release announcement, early demos or posts from influential accounts. As with any Smart Follower data, timing helps you form a hypothesis without necessarily telling you why each account chose to follow.
How should you apply a social graph in research or marketing?
Apply a social graph to understand an account's relationships within a relevant community. Begin with a specific question, verify graph coverage and time frame and then investigate connections underlying score data. Combine this contextual information with content posted by an account and any outcomes relevant to your decision-making process.
| Your question | Investigation areas |
|---|---|
| Is this creator relevant to our audience? | Connections/conversations within target community |
| Is this project generating new interest? | Changes in relevant followers/interactions over time |
| Does attention extend beyond one group? | Connections across multiple communities |
| Does this account contribute value? | Content posted by account; how informed participants engage with content |
Ensure consistency in comparisons. Accounts evaluated within differing communities or time frames may exhibit similar-appearing scores with dissimilar interpretations.
Returning to the campaign question at the start: if you want to reach people in your industry, prioritize the account whose audience includes those people. A broad, diverse following may suit a wider awareness campaign, but size alone won’t tell you which account fits your goal.
A social graph helps you assess that fit. You can examine who follows an account, how those people connect to your target community and whether those relationships persist. Reviewing their conversations adds context about how actively they engage.
For marketing, this gives you a stronger basis for choosing campaign partners. For research, it helps you identify people and discussions worth following. The advantage comes from understanding who makes up an audience and why those connections matter to your objective.
FAQs
What is a social graph in layman's terms?
A social graph is a graphical representation depicting who is connected to whom. Nodes represent people or accounts, while edges represent relationships. Relationships can include follows, friendships, etc.
Is a social graph identical to follower count?
No. Follower count quantifies accounts following a particular participant. A social graph illustrates relationships among participants across a network, thereby enabling you to determine who followers are and how they relate to other participants.
What constitutes a weighted social graph?
A weighted social graph assigns values to connections. Values may reflect interaction frequency/recency or other selected signals. Interpretation of values is contingent upon systems; larger values do not necessarily indicate greater trust/expertise.
Do follows represent trust?
No. Follows can represent interest/disagreement/professional monitoring/personal connection. A follow graph illustrates relationships. However, it cannot establish why followers exist without additional context.
Can social graphs identify bots?
Social graphs can assist in identifying suspicious connection patterns, but they cannot unequivocally establish whether every account is automated/fake. Identification requires additional evidence, and automation itself does not necessarily imply deception/abuse.
Who generates Kaito Smart Followers and what does this metric measure?
Kaito surfaces Smart Followers metrics. Smart Followers are identified via high inter-following ratios within Crypto, AI and Stocks Twitter's social graph. Smart Follower count illustrates how many identified accounts follow a particular account, providing community context for its total follower count.
Is Smart Follower count equivalent to mindshare?
No. Smart Follower count describes connections to a predefined group of accounts. Mindshare assesses a subject's share of attention within a comparison group/timeframe. One addresses relationships, the other addresses attention.
Does higher credibility scores signify accuracy?
No. Credibility scores reflect assumptions/signals employed by systems generating them. Credibility scores may assist in identifying accounts worthy of investigation with accuracy being evaluated via claims/evidence/track record.